Debugging Application
- Make sure you have installed composer dependencies first of all
Enabling Debug Output
To see which templates are used during page rendering, enable debug output in the settings/settings.ini.php file:
'debug_output' => true,
Disabling Cache
To see all used templates, you must also disable the cache.
'templatecache' => true,
'templatecompile' => true,
'modulecompile' => true,
Modify index.php to enable debug output directly
This should be used only as a last option if anything else does not work.
and change to
@ini_set('error_reporting', 1);
@ini_set('display_errors', E_ALL);
Web Application Folder Structure
The web application has the following folder structure:
cache(Stores cached files)design(Contains design categories)<used_design>
doc(Release documentation)extension(All extensions are placed here)ezcomponentslib(Core of the framework)autoloadslhcore_autoload.php(Main application autoload file)
core(Folder containing application logic modules)models(Folder containing application model classes)modules(Application modules are placed here)pos(Represents eZ Components POS, persistent object tables definitions)settings(Contains application settings files)translations(Contains application translations)
How to Log JavaScript Errors
Go to System configuration > Audit (Configuration) and enable Log javascript errors. After that, any JavaScript errors will be logged to System configuration > Audit (Audit Logs).
You can search for JavaScript errors using these search attributes:
- Category -
js - Source -
lhc
Using JavaScript Logs
Most of the time, the compiled JS file has a map file. For example, if an error occurred in:
https://demo.livehelperchat.com/design/defaulttheme/js/widgetv2/index.js
There will also be a source map file:
https://demo.livehelperchat.com/design/defaulttheme/js/widgetv2/index.js.map
Afterwards, you can use https://jimbly.github.io/stackwalker/index.html to find the exact error.
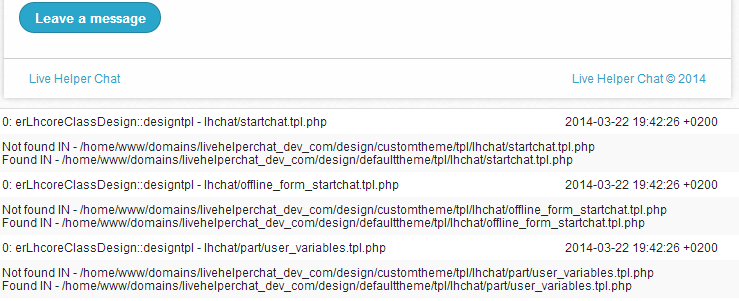
How to Use Debug Output
After enabling debug output, you will see a popup window similar to this:
Regarding widget debugging, you will not see debug output so easily. These instructions also apply to embedded widgets and site widgets.
Understanding Debug Output

As shown in the example above, widget styles can be overridden by editing the customtheme/css/widget_override.css file. The debug output shows all files searched during page load. If you want to edit the invitation to chat green block, the easiest way to do that is to override the styles using the !important flag. These styles should be in your site CSS file, not the widget_override.css file.
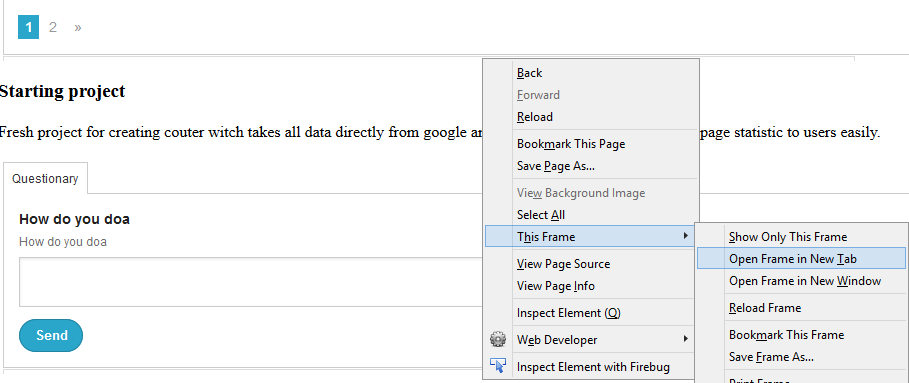
Debugging the Old Widget
Chrome
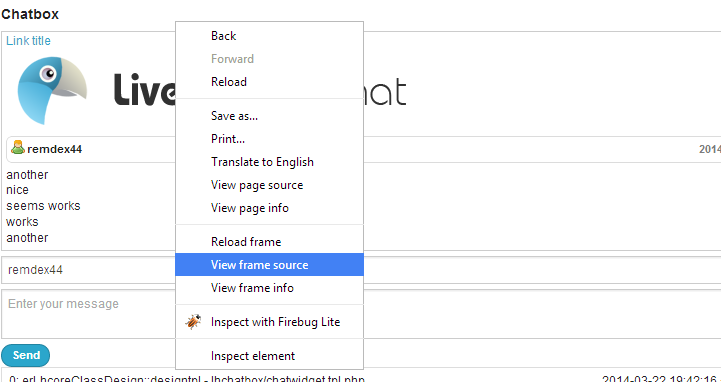
After doing that, a new window will open in Chrome. Just delete "view-source:" and you will see the full list.
Firefox
What to Do If the App Returns a White Screen During an Action
- Disable cache
- Enable debug output
- Check
cache/default.logfor an error message. - Check the Chrome console for an error (
CTRL+SHIFT+J). - Read My widget does not load
- See the Audit Logs section for an error.
- Debugging incoming webhooks