Statistic
If you have large number of chats I would suggest to use ElasticSearch plugin for statistic generation. In any case with relative small number of chats default functionality also works. Here are all charts you can generate.
Statistic
Main statistic tab. These charts are grouped by month by default. If you want grouping by day use Chats statistic tab.
Terminology
Attributes used for closing chat
lsync- time last time we saw a visitor.pnd_time- time since chat become pending. This can be different than chat start time. (Bot transfer chat to pending state)wait_time- how long visitor waited before chat was accepteduser_id- operator id
Transfer happened
- Chat has transfer set
transfer_uid - Chat has owner set
user_id - Operator who transferred and chat owner is not the same
Rule in the code look slike
(`lh_chat`.`transfer_uid` > 0 AND `lh_chat`.`transfer_uid` != `lh_chat`.`user_id`)
Abandoned chat
Rule in the code looks like
((`lsync` < (`pnd_time` + `wait_time`) AND `wait_time` > 1) OR (`lsync` > (`pnd_time` + `wait_time`) AND `wait_time` > 1 AND `user_id` = 0))
- Last time we saw a visitor is less than the time chat was accepted and wait time was longer than 1 second. Chat's where only bot participated wait time is equal to 1. That's why we have to check only wait time > 1
- Last time we saw visitor is greater than wait time but user is not assigned to a chat.
Dropped chat
Rule in the code looks like.
(`lsync` > (`pnd_time` + `wait_time`) AND `has_unread_op_messages` = 1 AND `user_id` > 0)
- Chat was accepted by operator
- Visitor was seen after chat was accepted
- Chat has unread operator messages
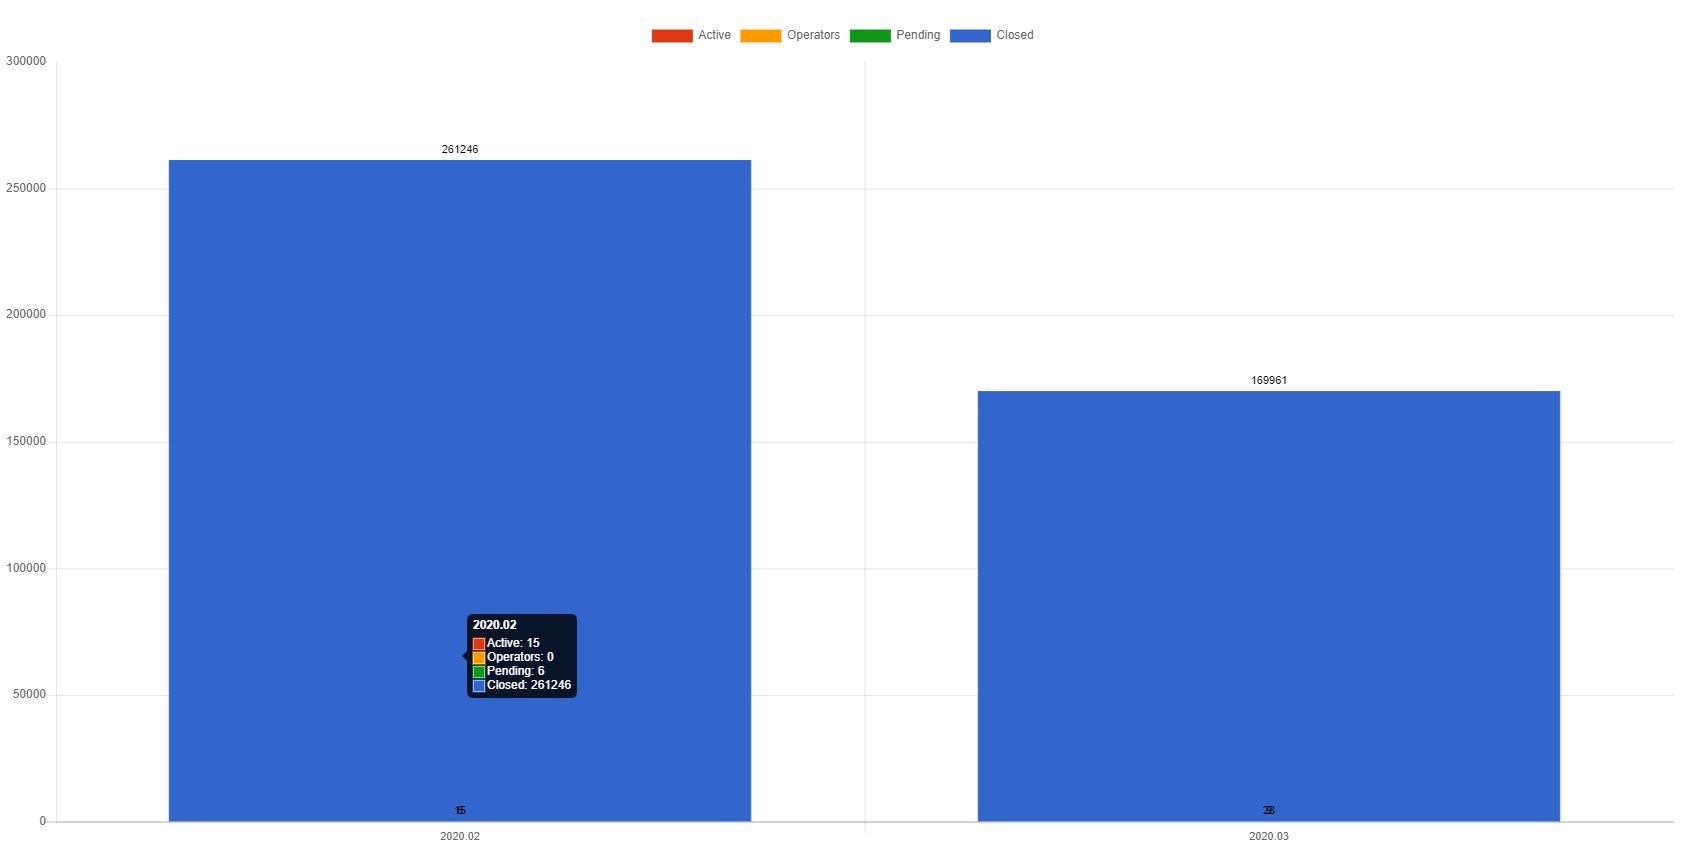
Chat numbers by status
Usefull to see general number of chats.
Unanswered chat numbers
If visitor writes a message and chat is pending. Chat becomes unanswered.
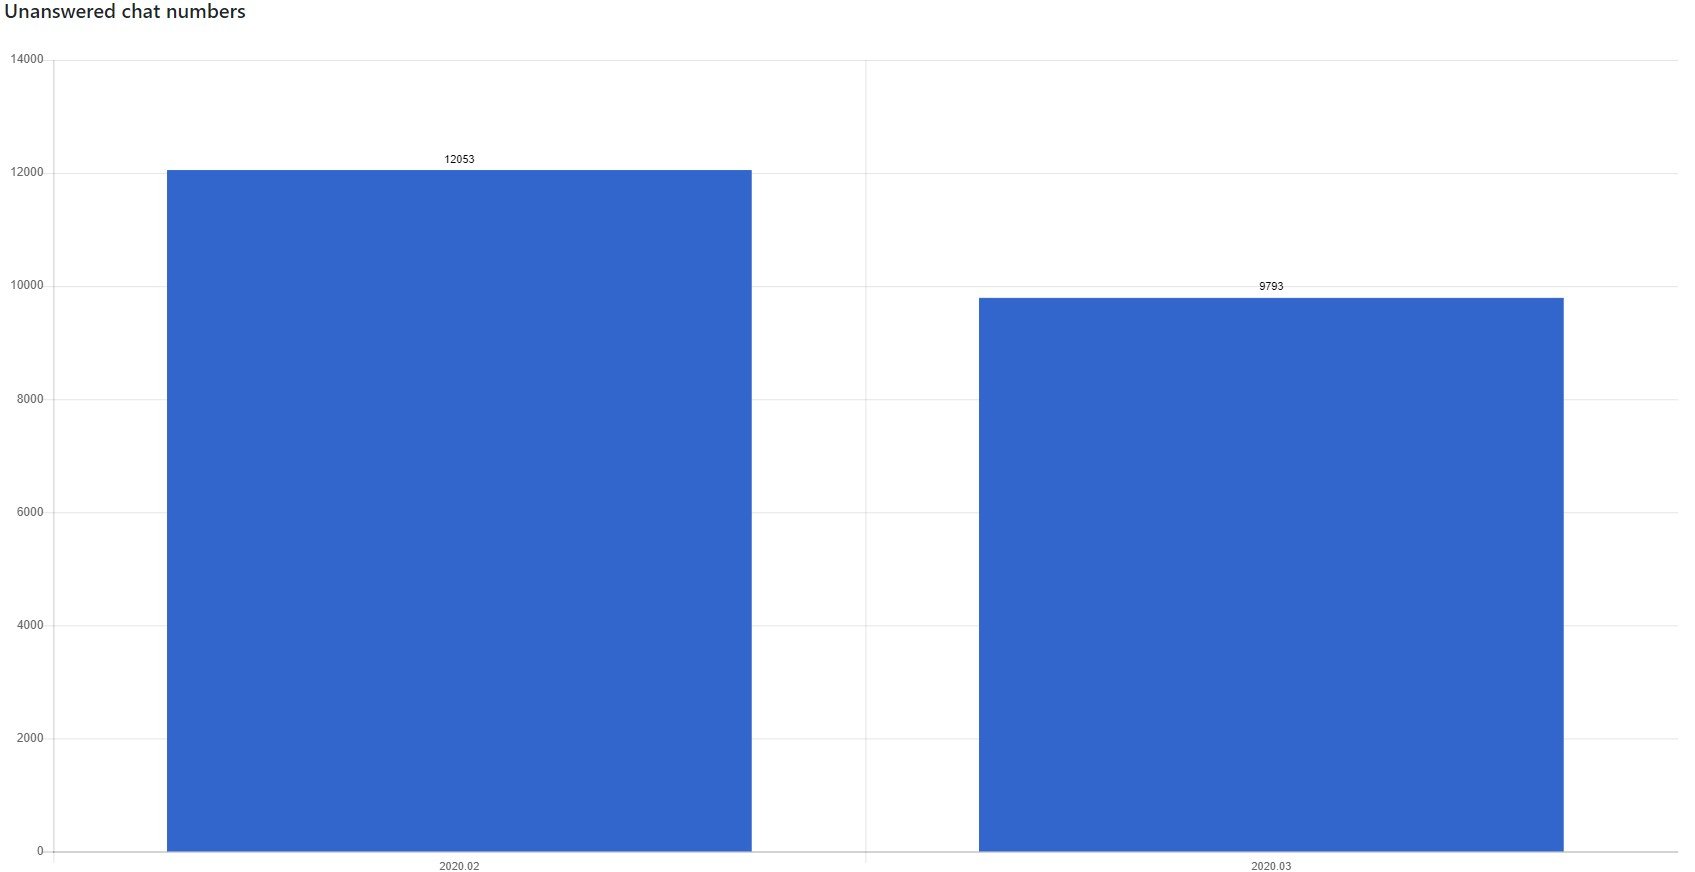
Chat remains unanswered even if operator accepts a chat if
- Visitor has closed the chat
- From last message sync passed more than 60 seconds on desktop devices OR more than 240 seconds on mobile devices.
As second condition can be false positive. E.g Visitor just left the chat and operator accepted a chat this flag would be removed.
It's recommended to check just filter Abandoned chat
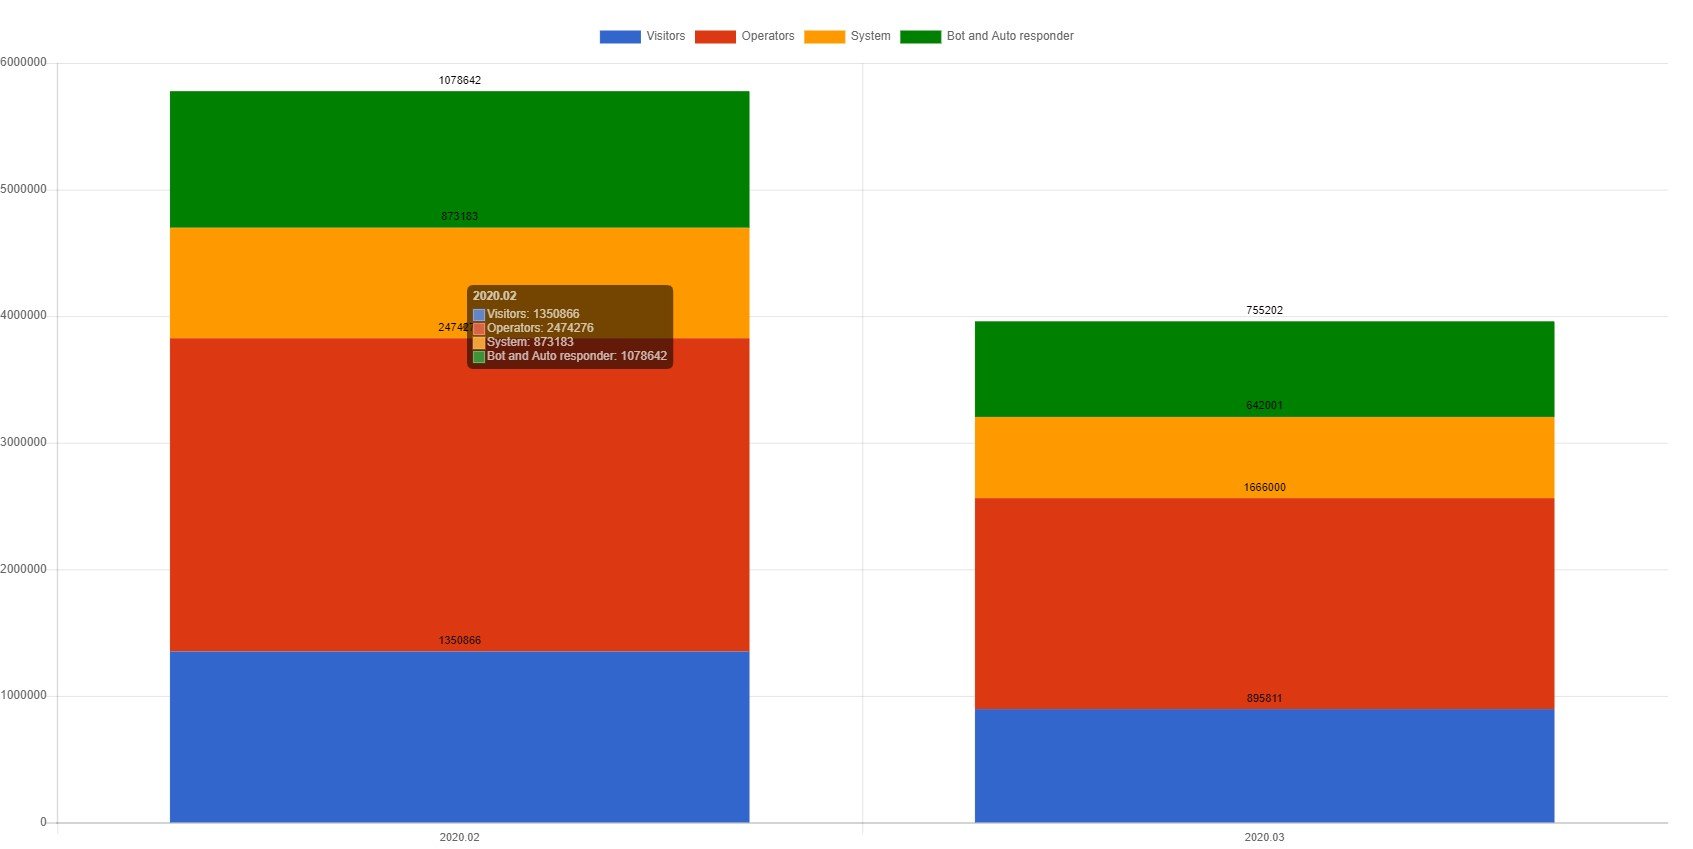
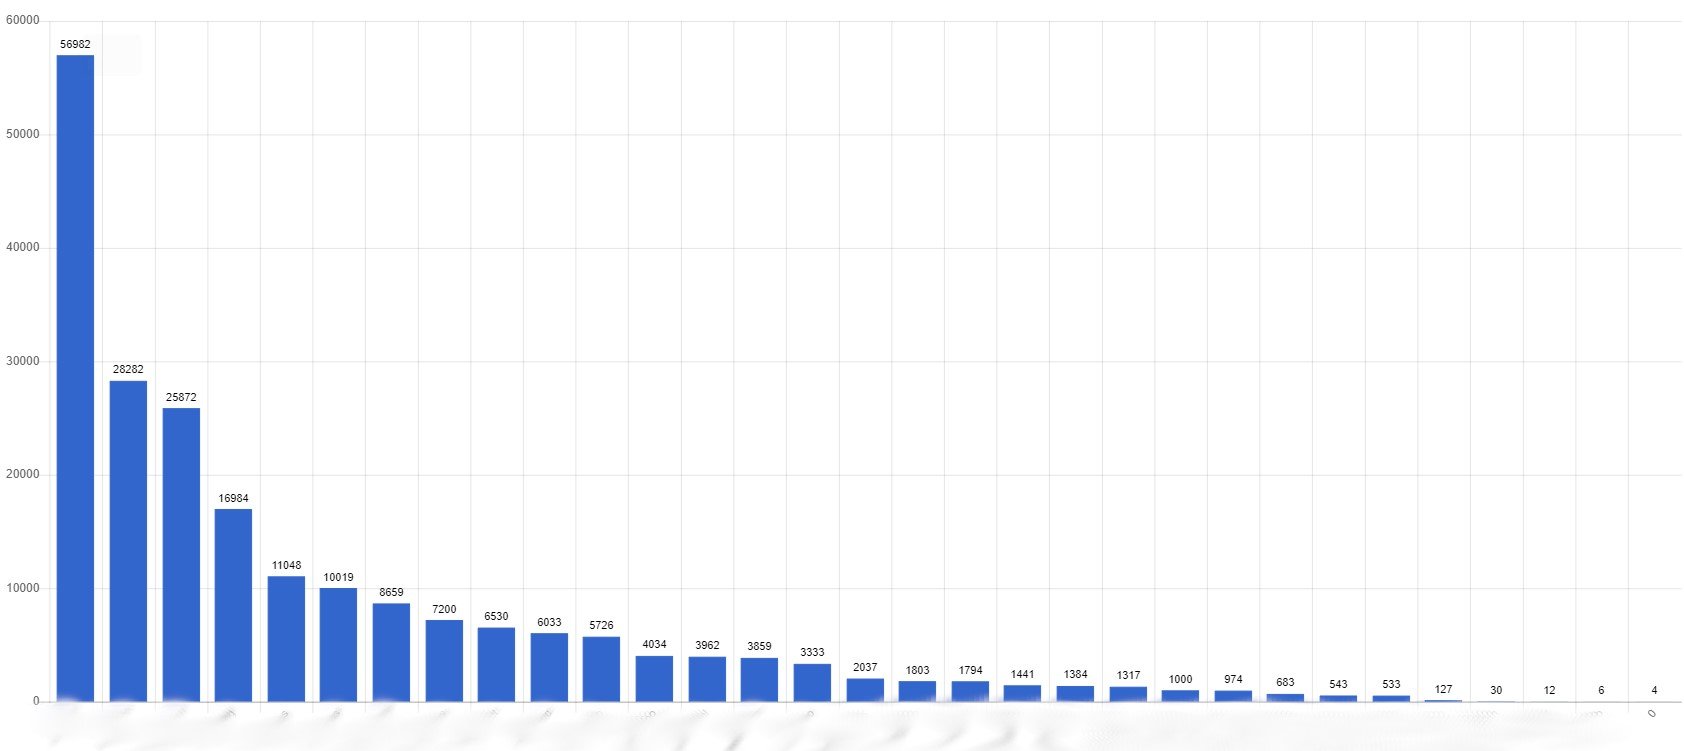
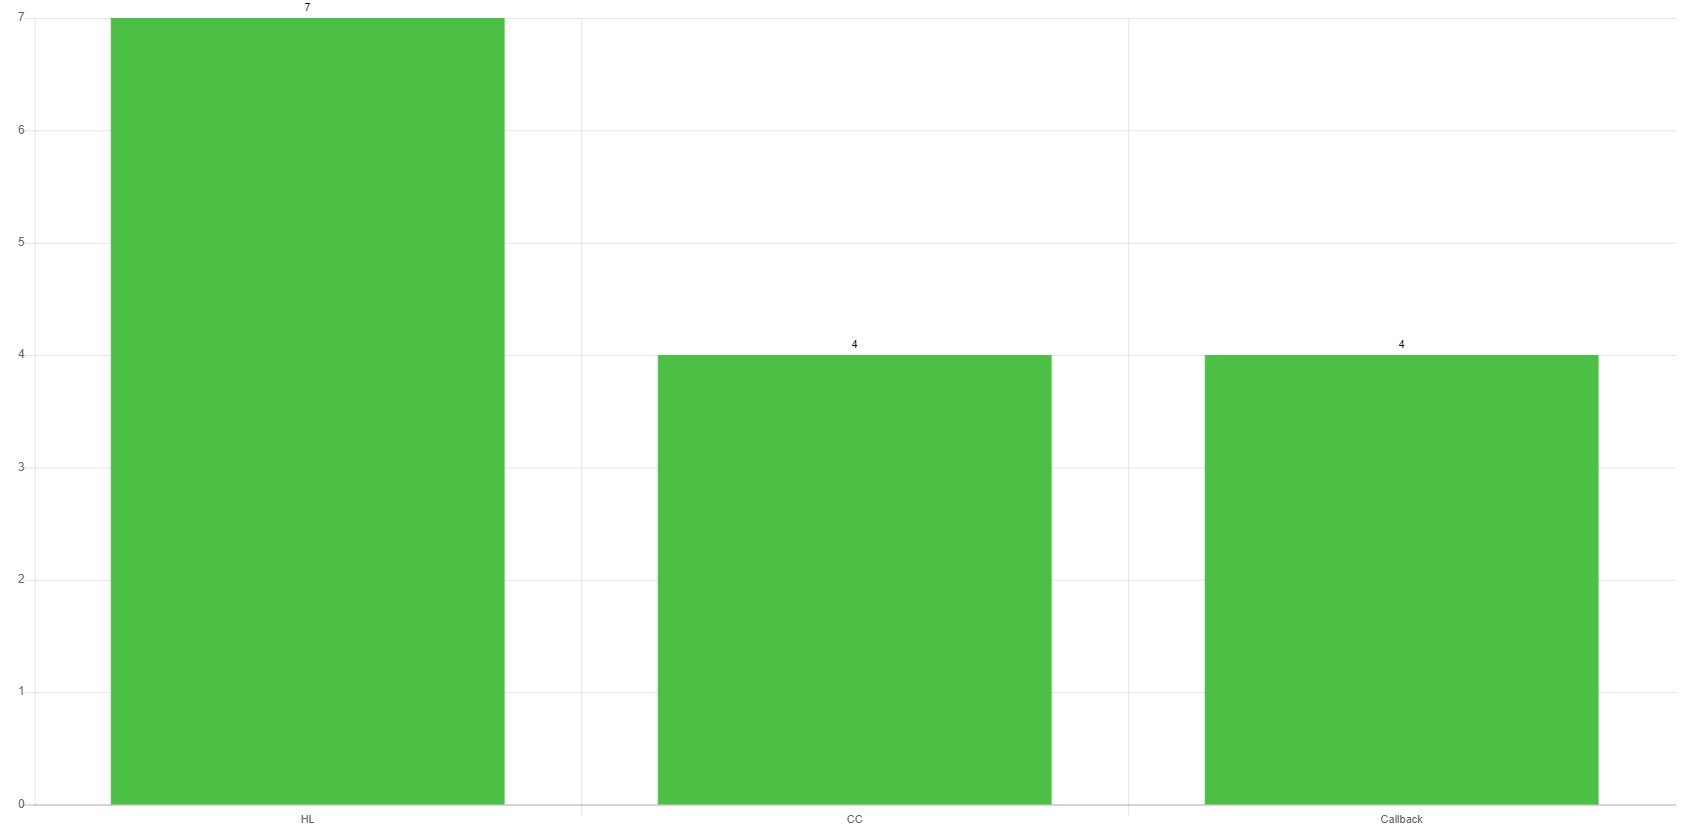
Message types
Let's you see what types of messages were most popular.
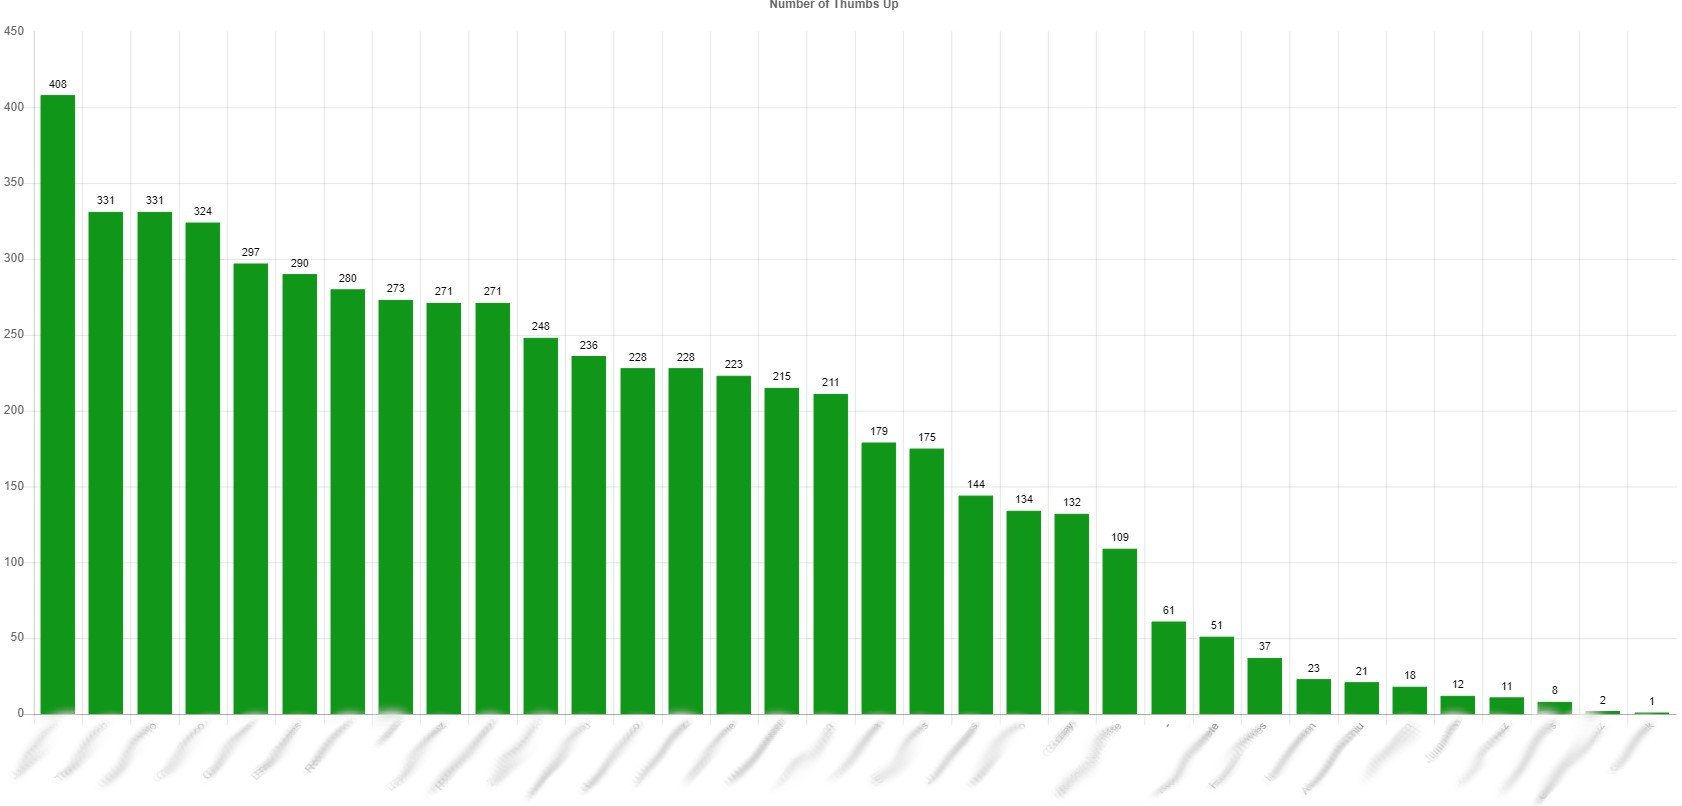
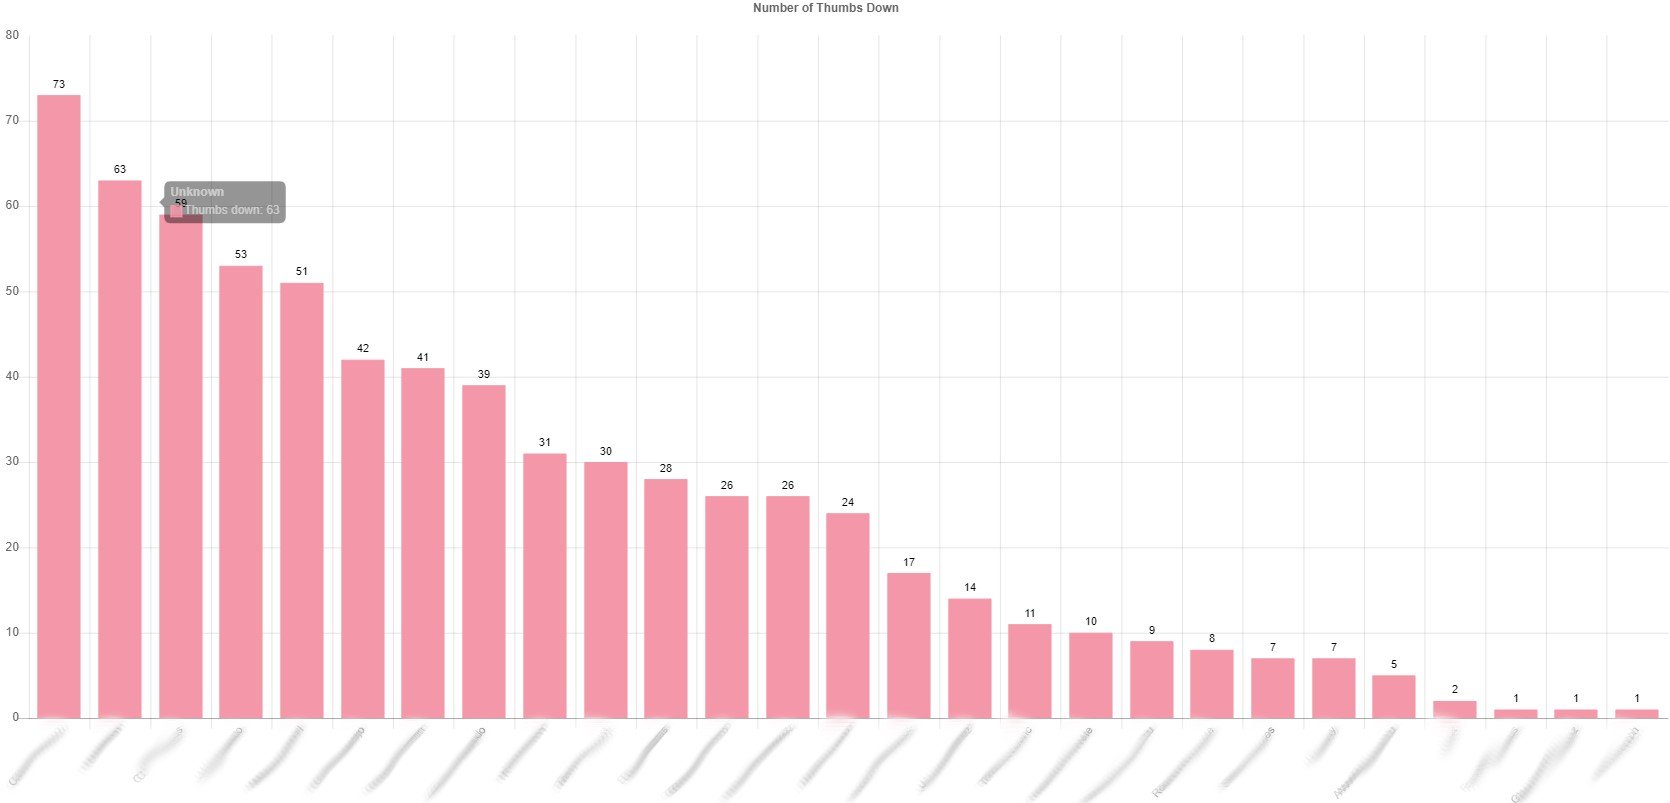
Number of Thumbs Up/Down
Displays what operators received most thumbs up
Displays what operators received most thumbs down
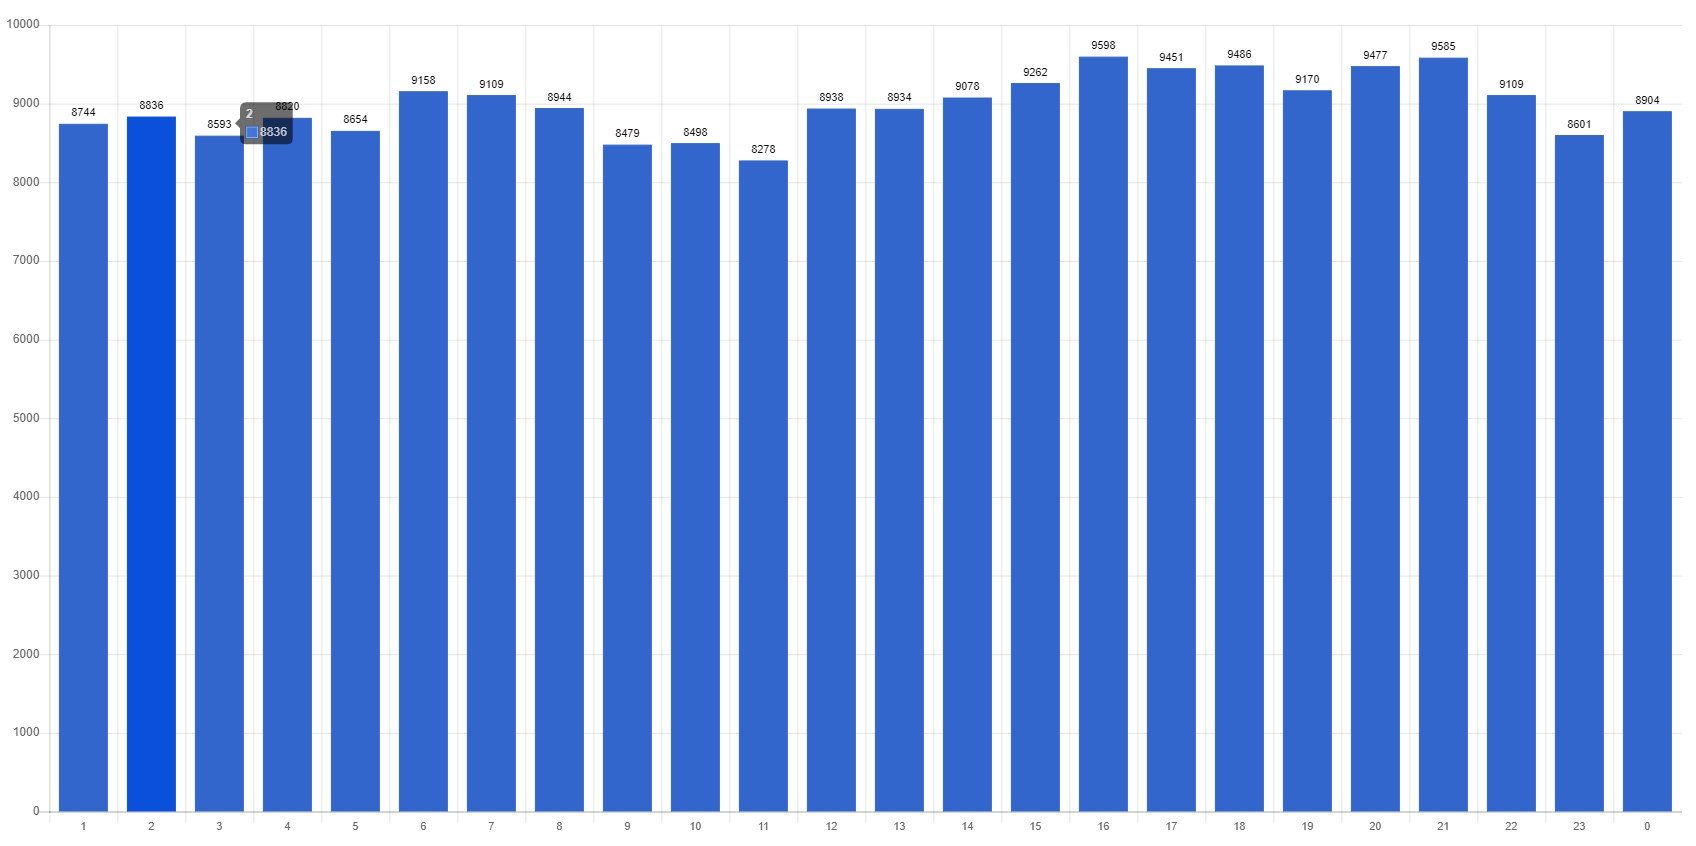
Average number of chats & peak per hour
Shows maximum chats per hour logged.
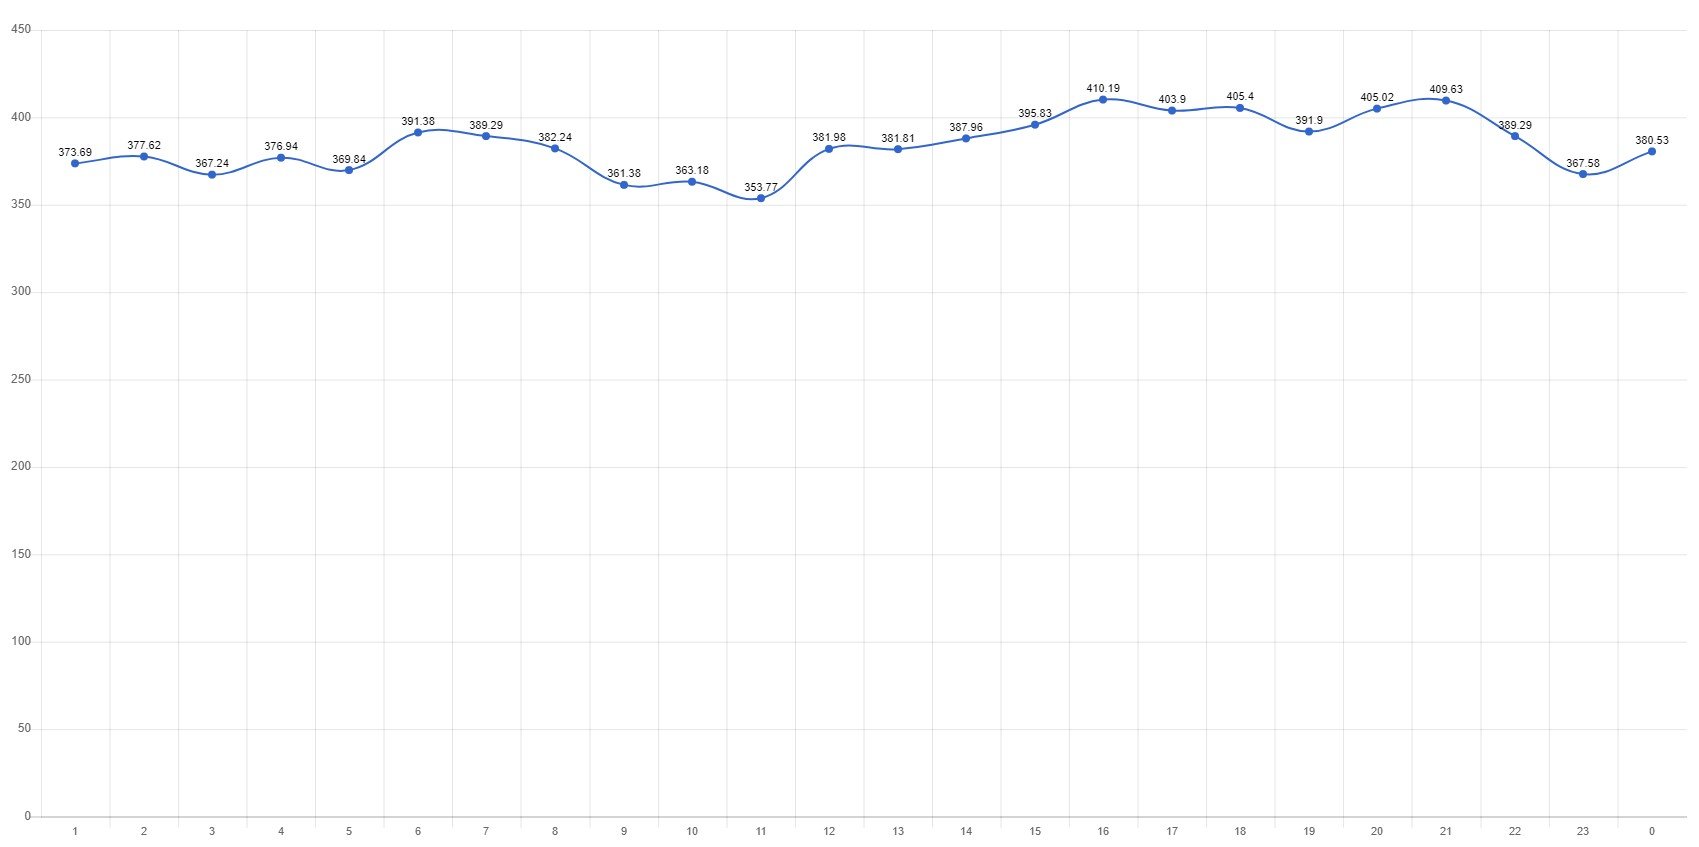
Number of chats per hour, average chat duration 08 m. 32 s.
Chat duration is calculation
Chat duration is calculated by summarising time spend between message if they do not exceed defined thresholds.
- How long operator can wait for message from visitor before time between messages are ignored. Values in minutes. (4 minutes default)
- How long visitor can wait for message from operator before time between messages are ignored. Values in minutes. (10 minutes default)
These values can be changed in Chat configuration -> Misc
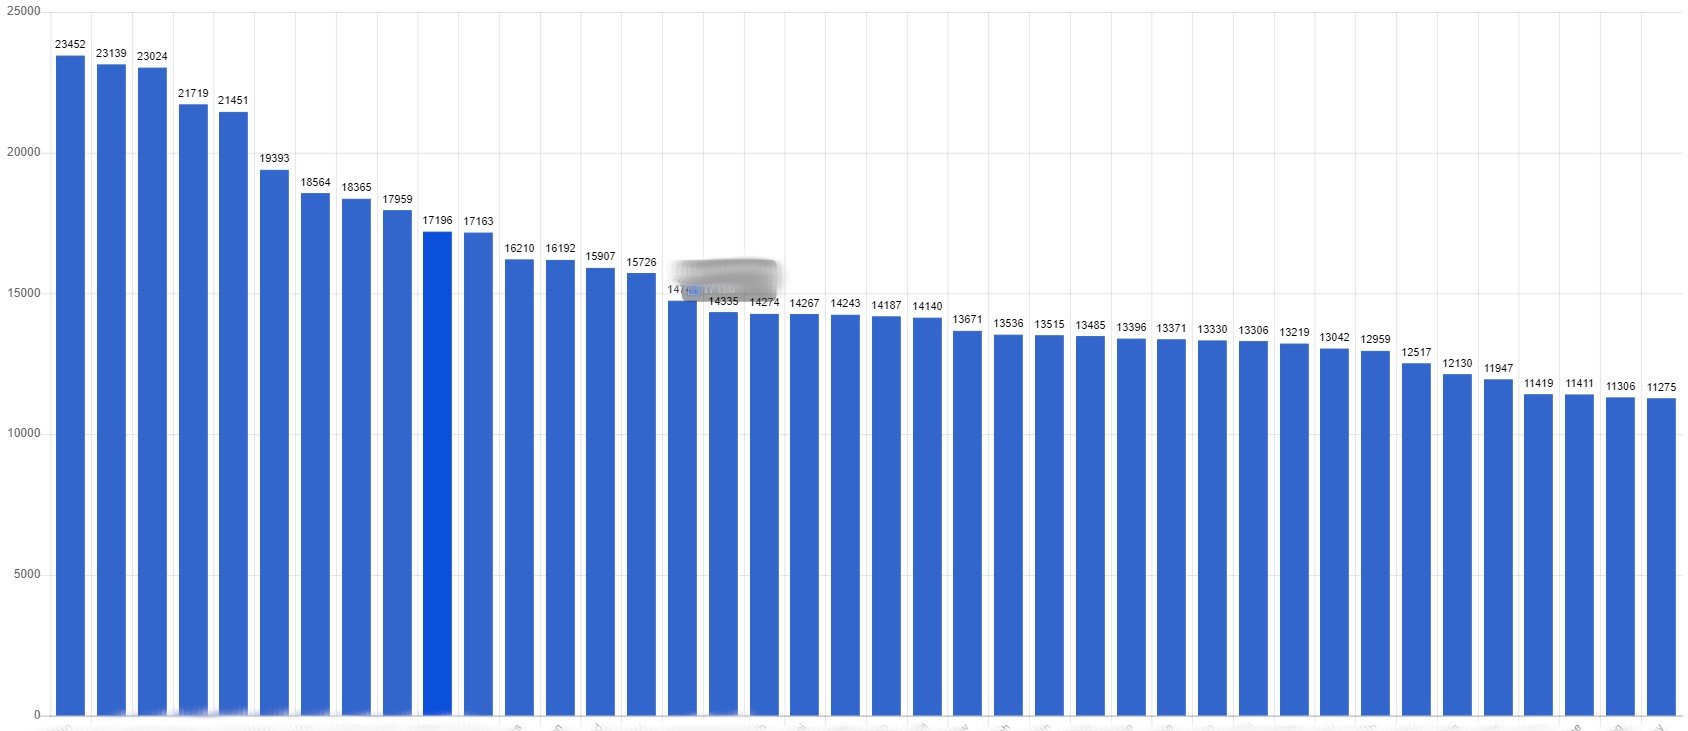
Chart example
Shows total number of chats logged per hour for selected period. In this case it was for two weeks.
Number of chats by department
This way you can know which department had largest number of chats.
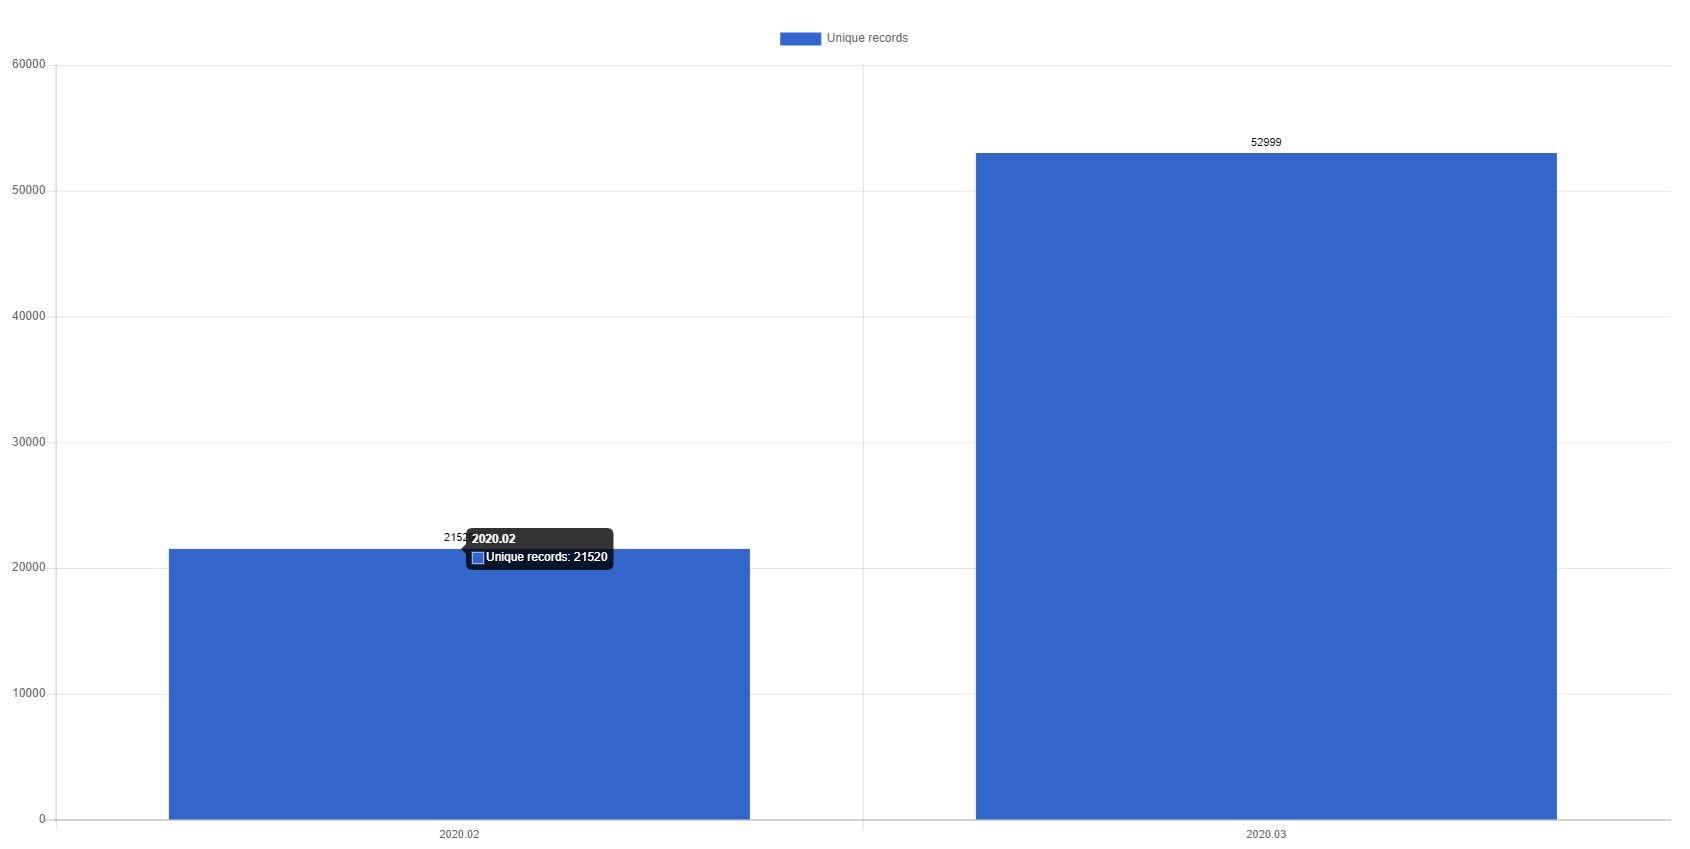
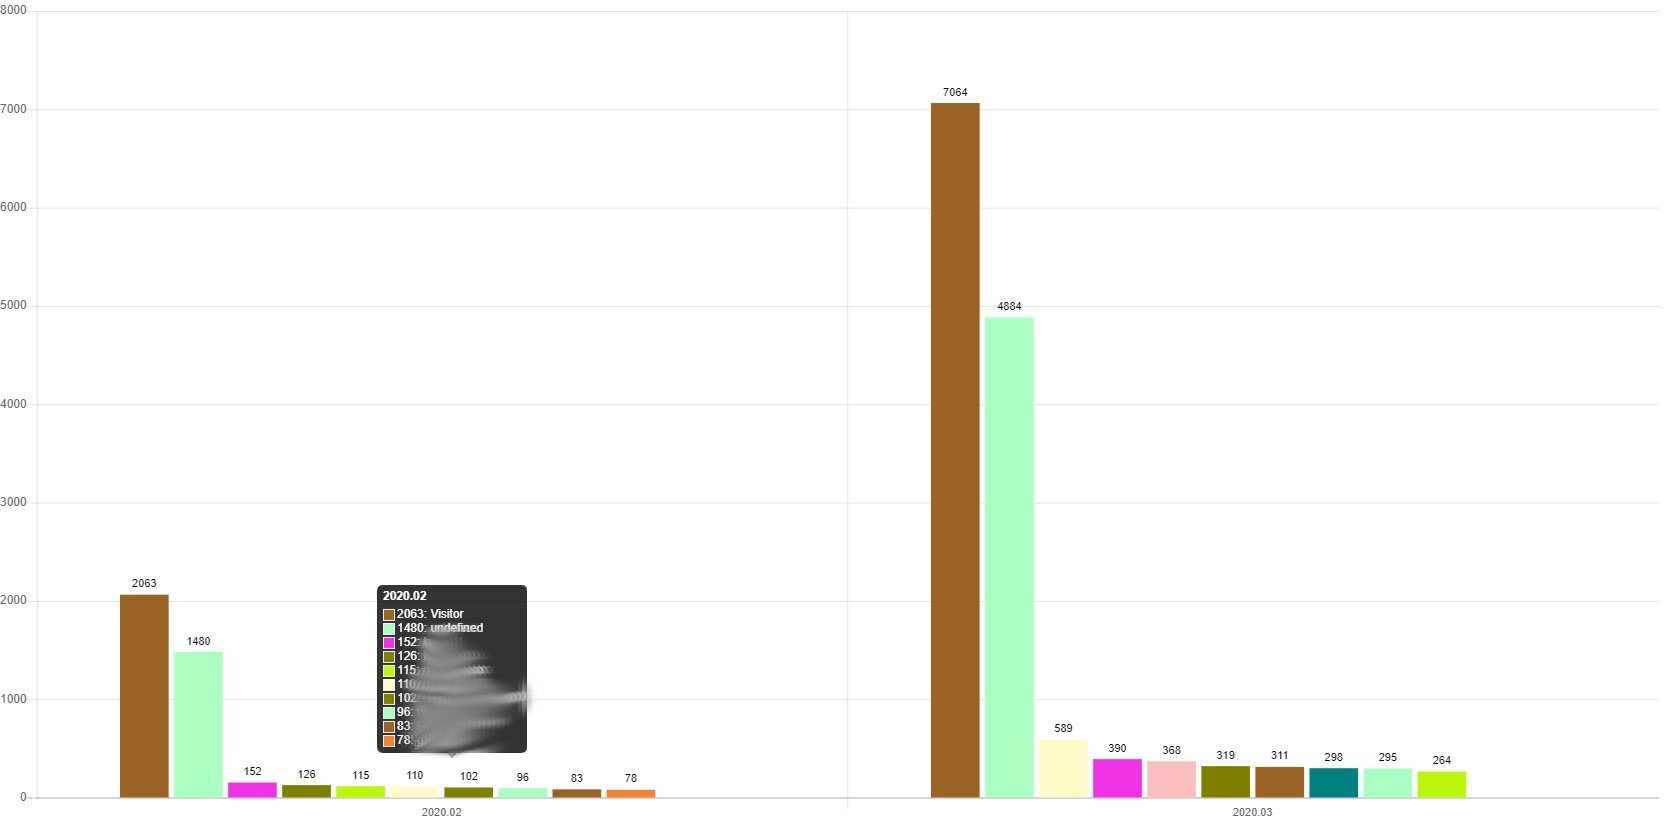
Unique group field records grouped by date
Unique nick's grouped by date. With extension you can add more fields you would like to group by.
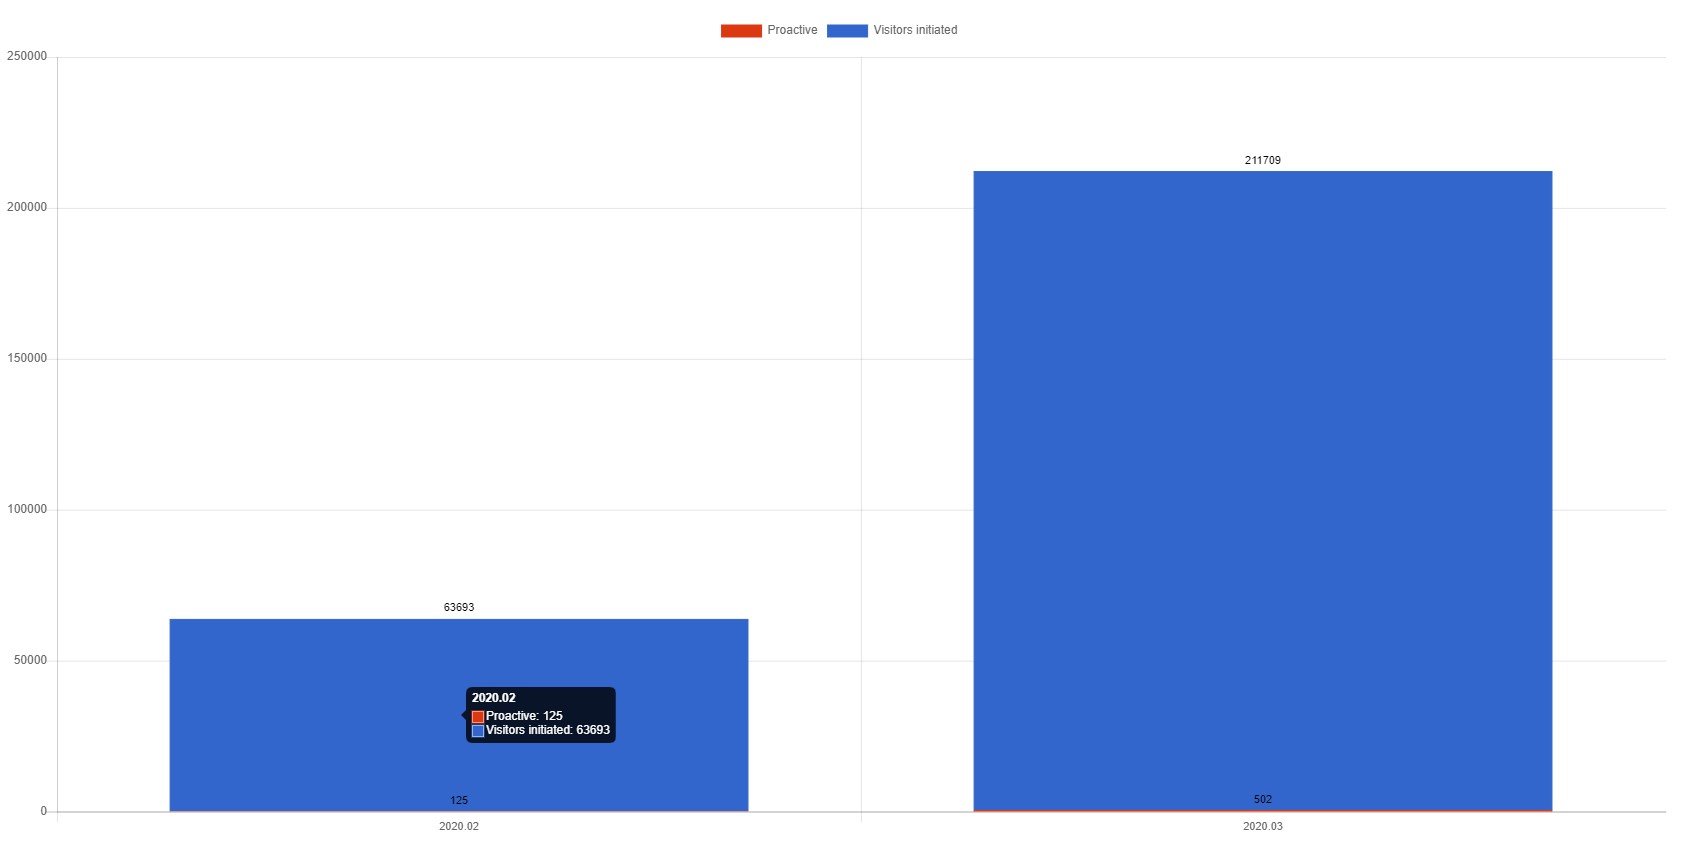
Proactive chats number vs visitors initiated
From this chart you can see how many chats were initiated by proactive invitation and how many started by a visitor.
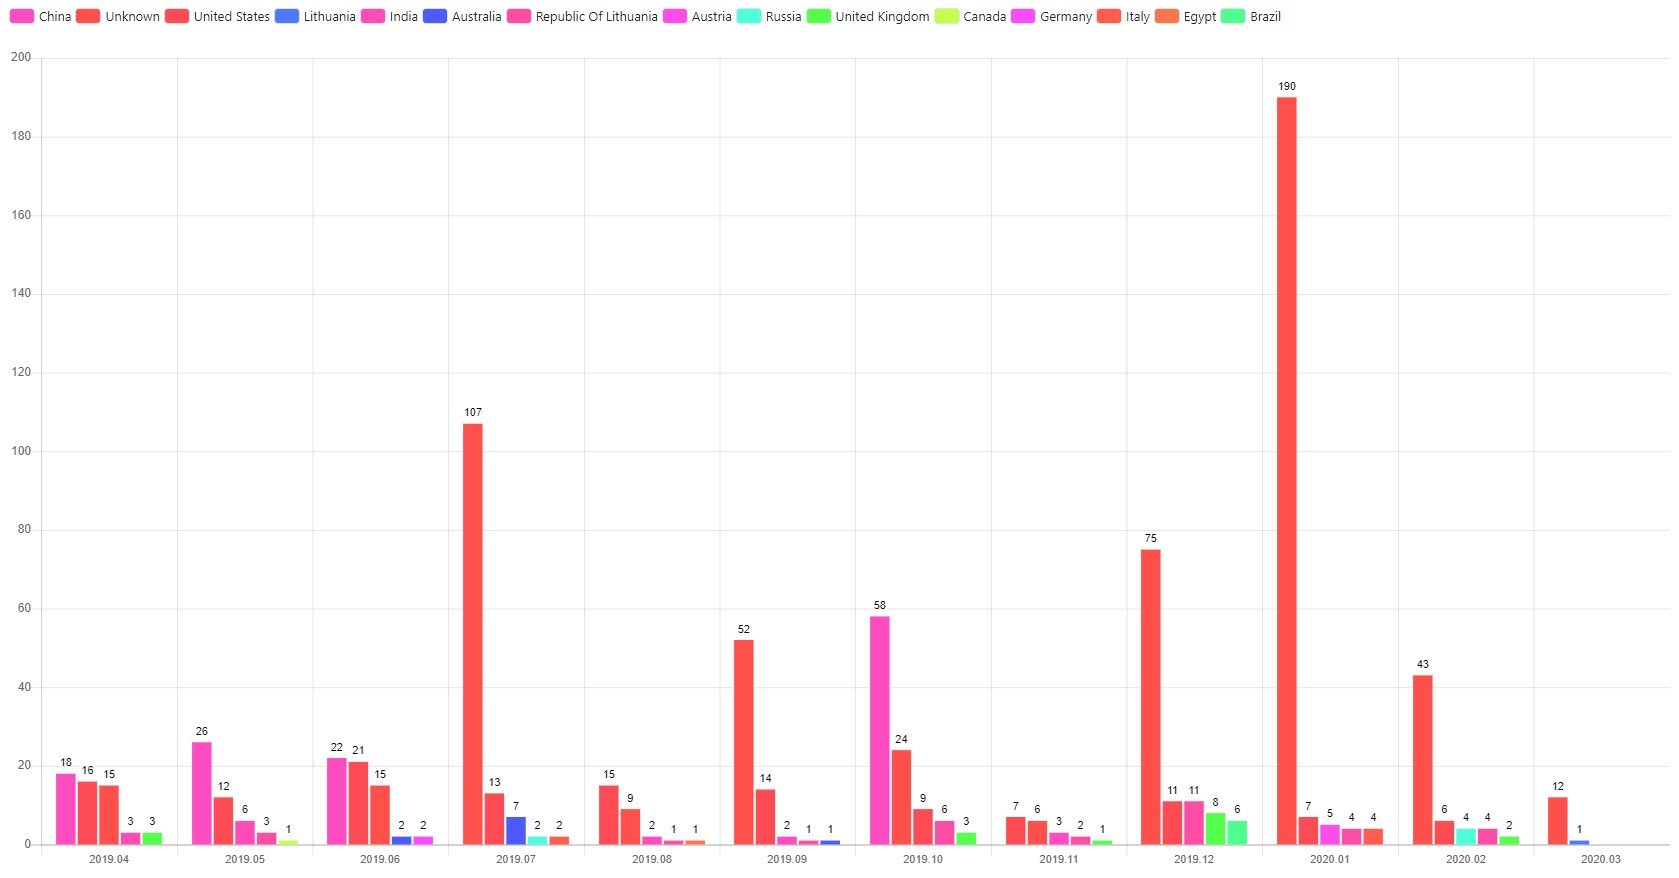
Number of chats by country
Average wait time in seconds (maximum of 10 minutes)
Wait time being calculated by how long visitor waiting for chat becoming active after it became pending.
AVG visitor wait time by operator
You can see which operator is accepting chats with delay once chat being assigned to hom for example. If queue is big chat in any case would have longer wait time.
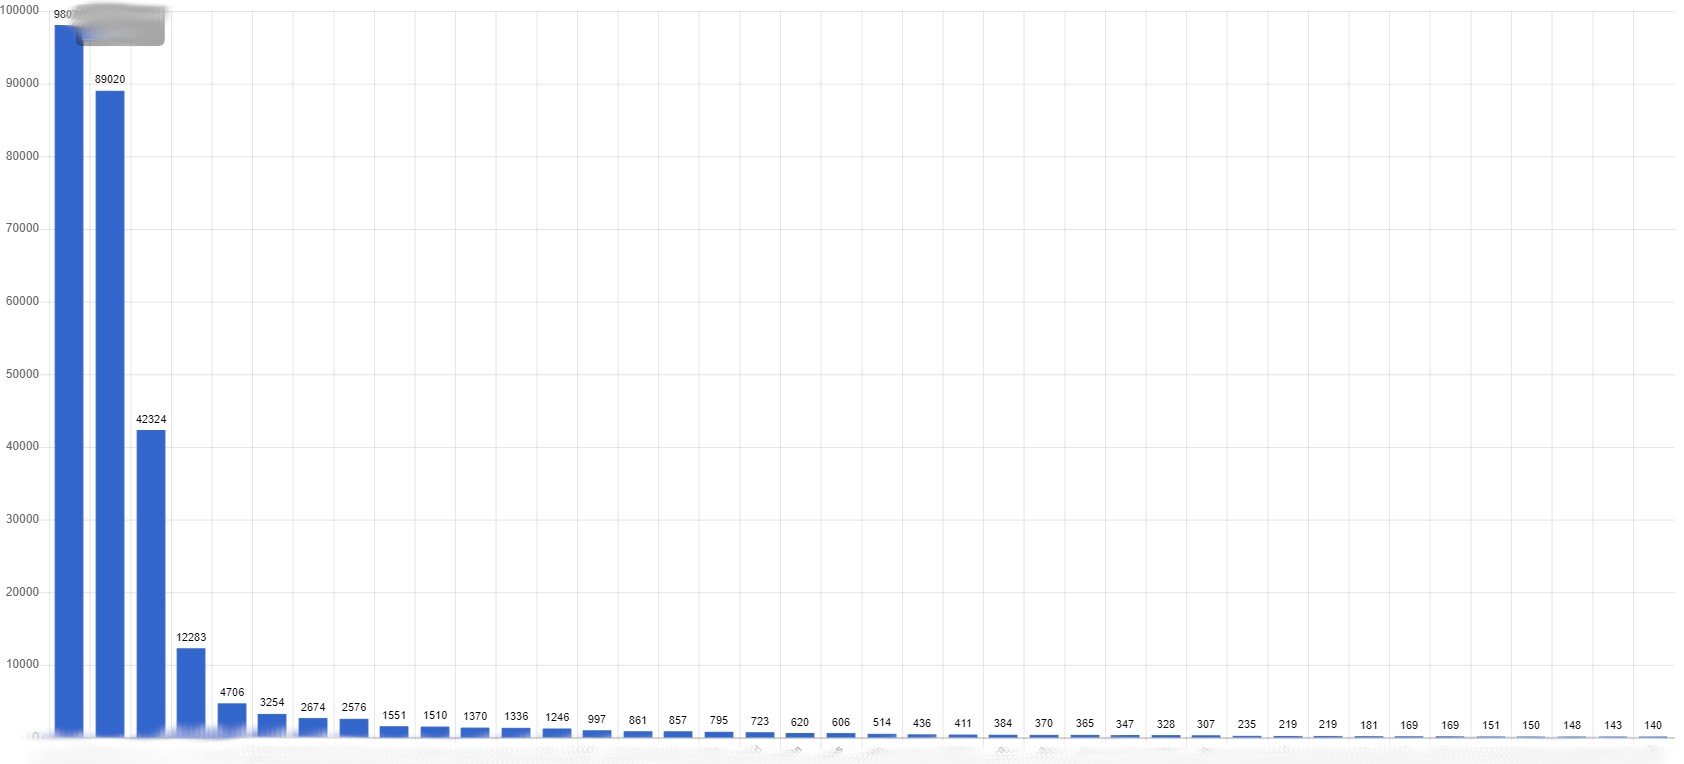
Chats number grouped by date and group field
In this chart, if you group by nick, you can see what visitor chatted the most. If you do not allow visitor enter nick and prefill it's good way to know what visitor had biggest number of chats.
Number of chats by subject
If you are using subjects later you can generate graph like this.
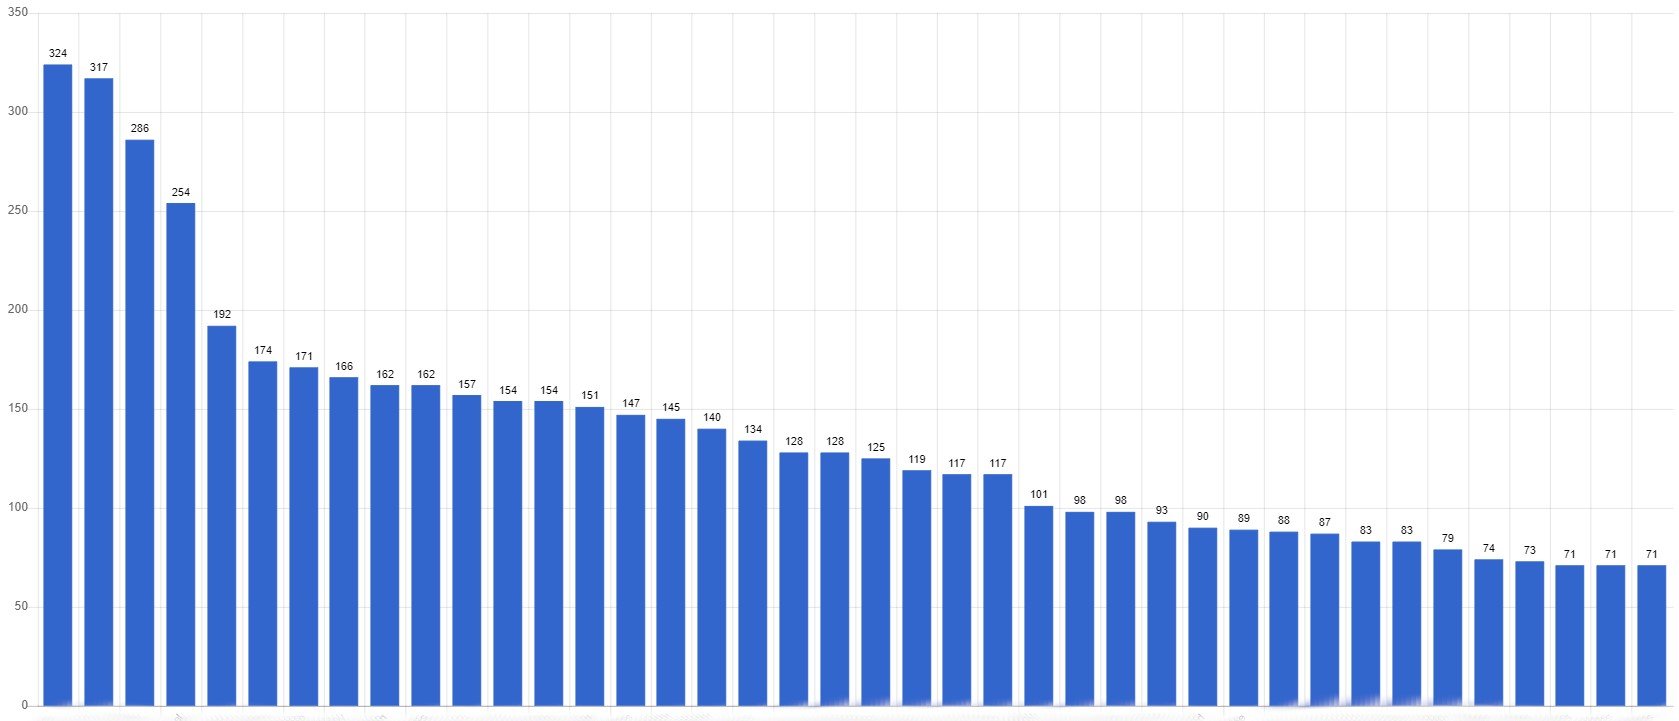
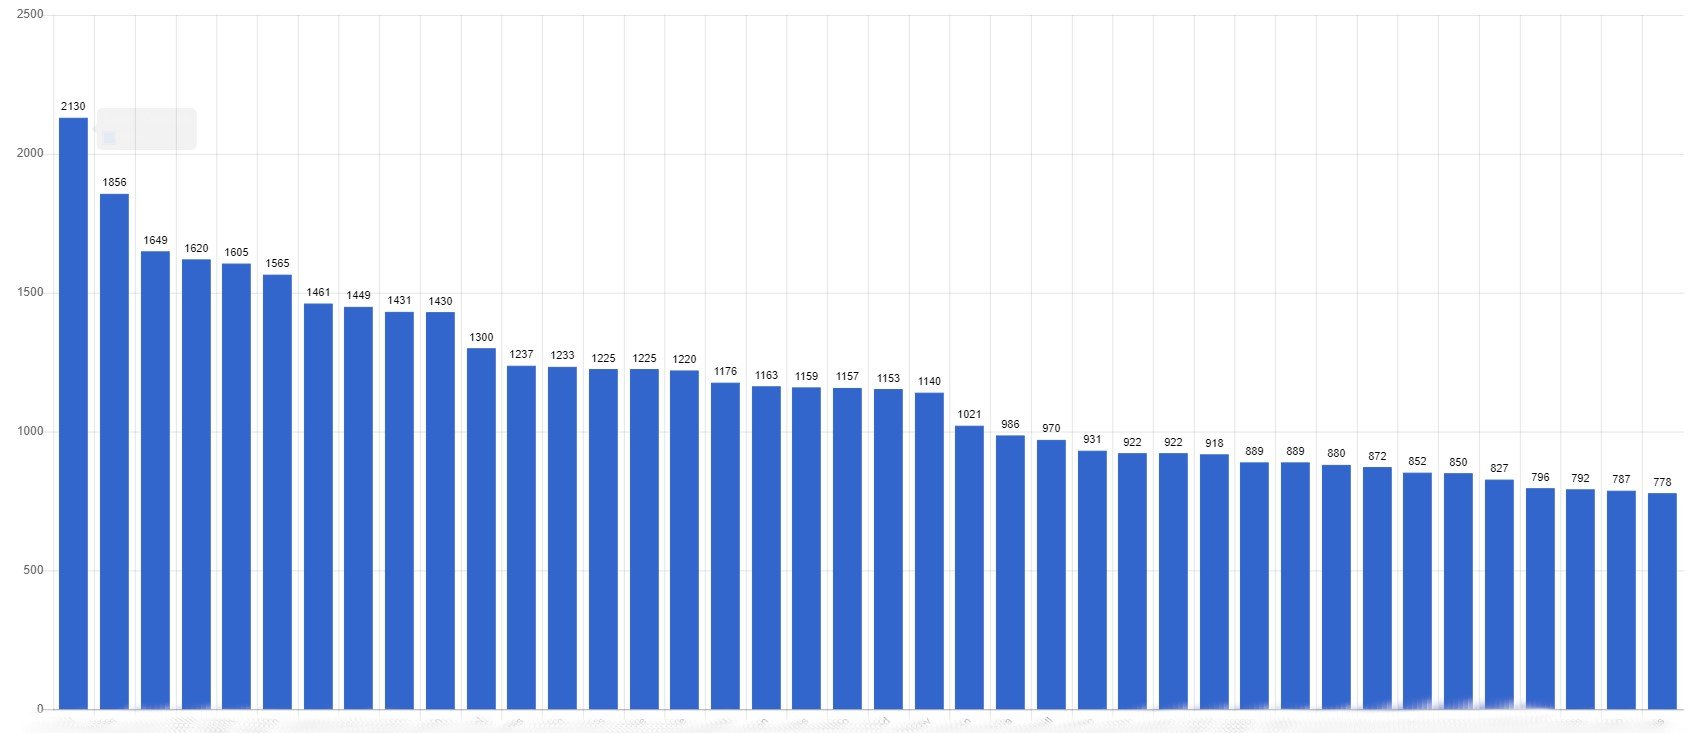
Number of messages by user
You can see what operator had send biggest number of message for selection period of time.
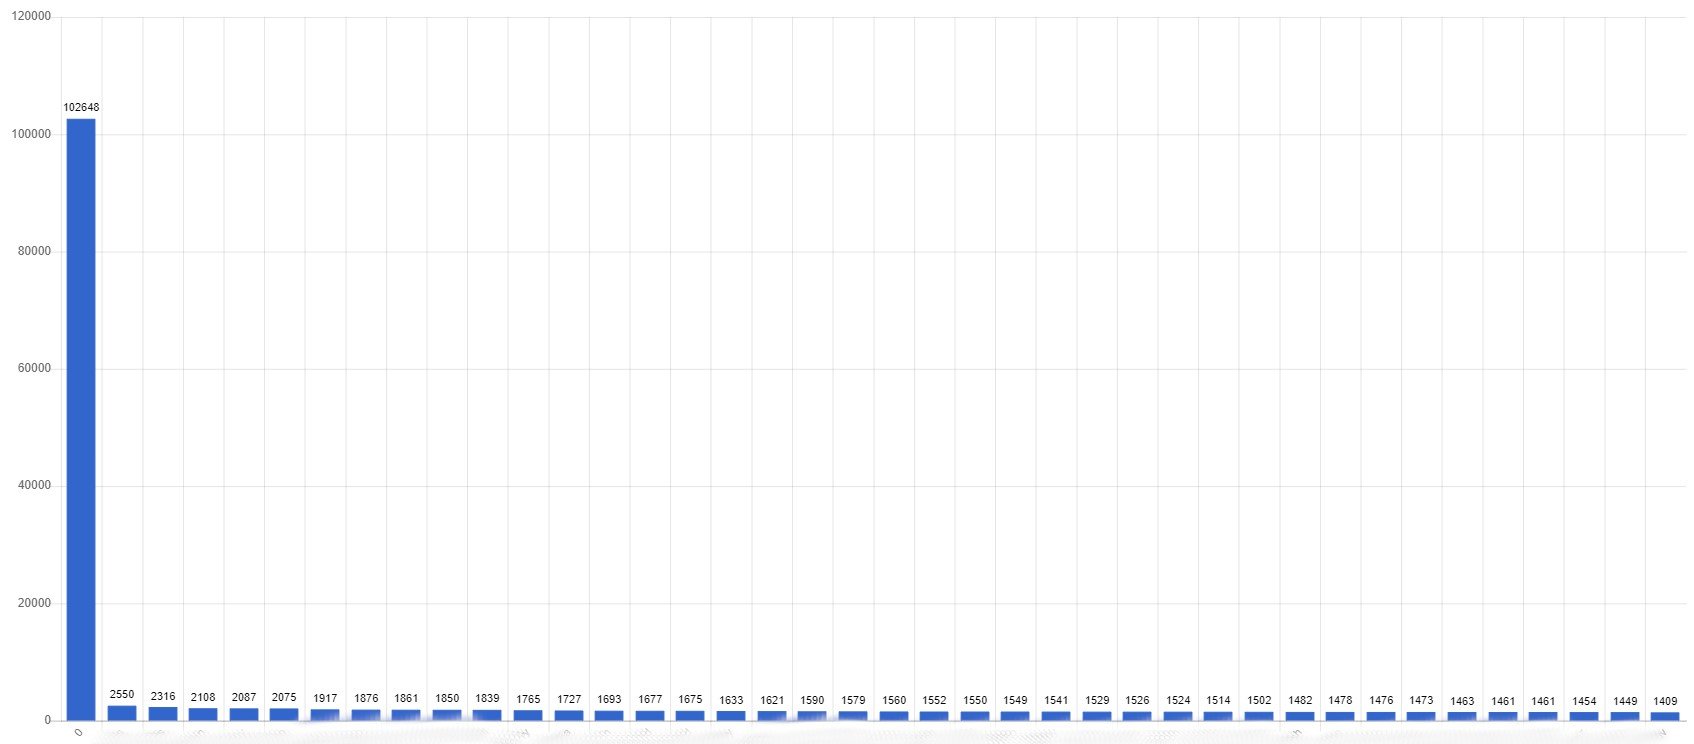
Number of chats by user
You can see what operator had biggest number of chats for selection period. 0 in this chart means bot. So you can see how many chats were served directly by bot.
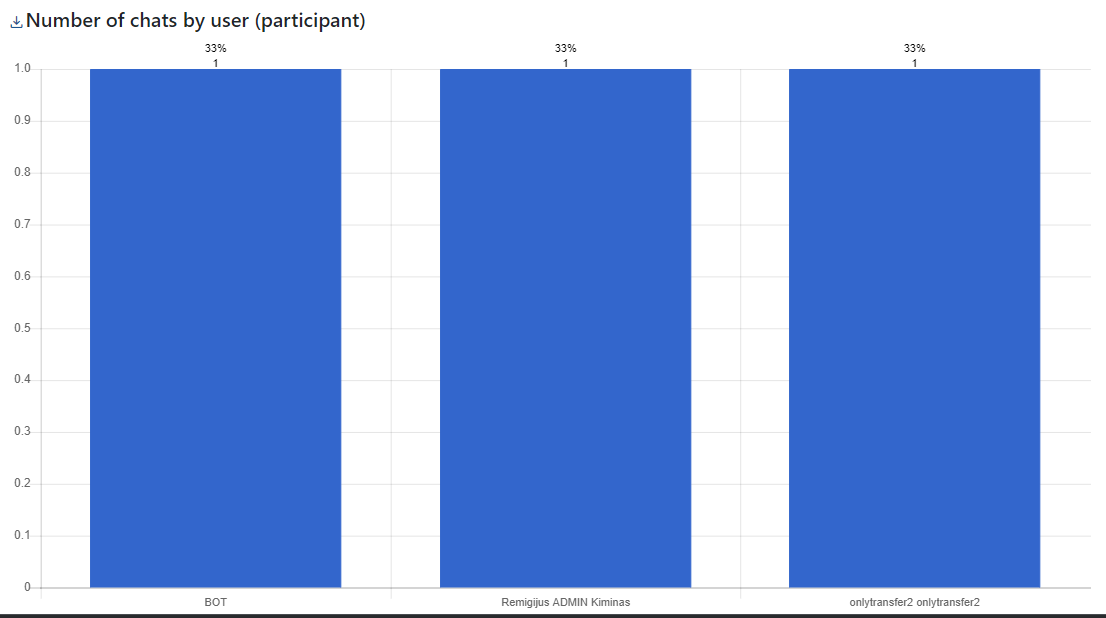
Number of chats by user (participant)
Difference from above one that once chat can have multiple agents in that scenario both agent would be counted as participants.
Number of chats by transfer operator
- It shows operator and number of transfers he did.
- While generating chart I suggest to choose in filters
Transfer happenedso only real transfers will be presented. - If
Transfer happenedoption is not chosen First column will be all chats without transfer. We are grouping by operator who transferred and because it's none. It will have a highest number of records. - If you choose
Chats with an operatorwe will make sure that chat owner and operator who transferred will be set. But they can match. That's the only difference fromTransfer happened
Average chat duration by user in seconds
You can see what operator takes longest time chatting with visitor. It means that his performance can be improved. This report can be downloaded also.
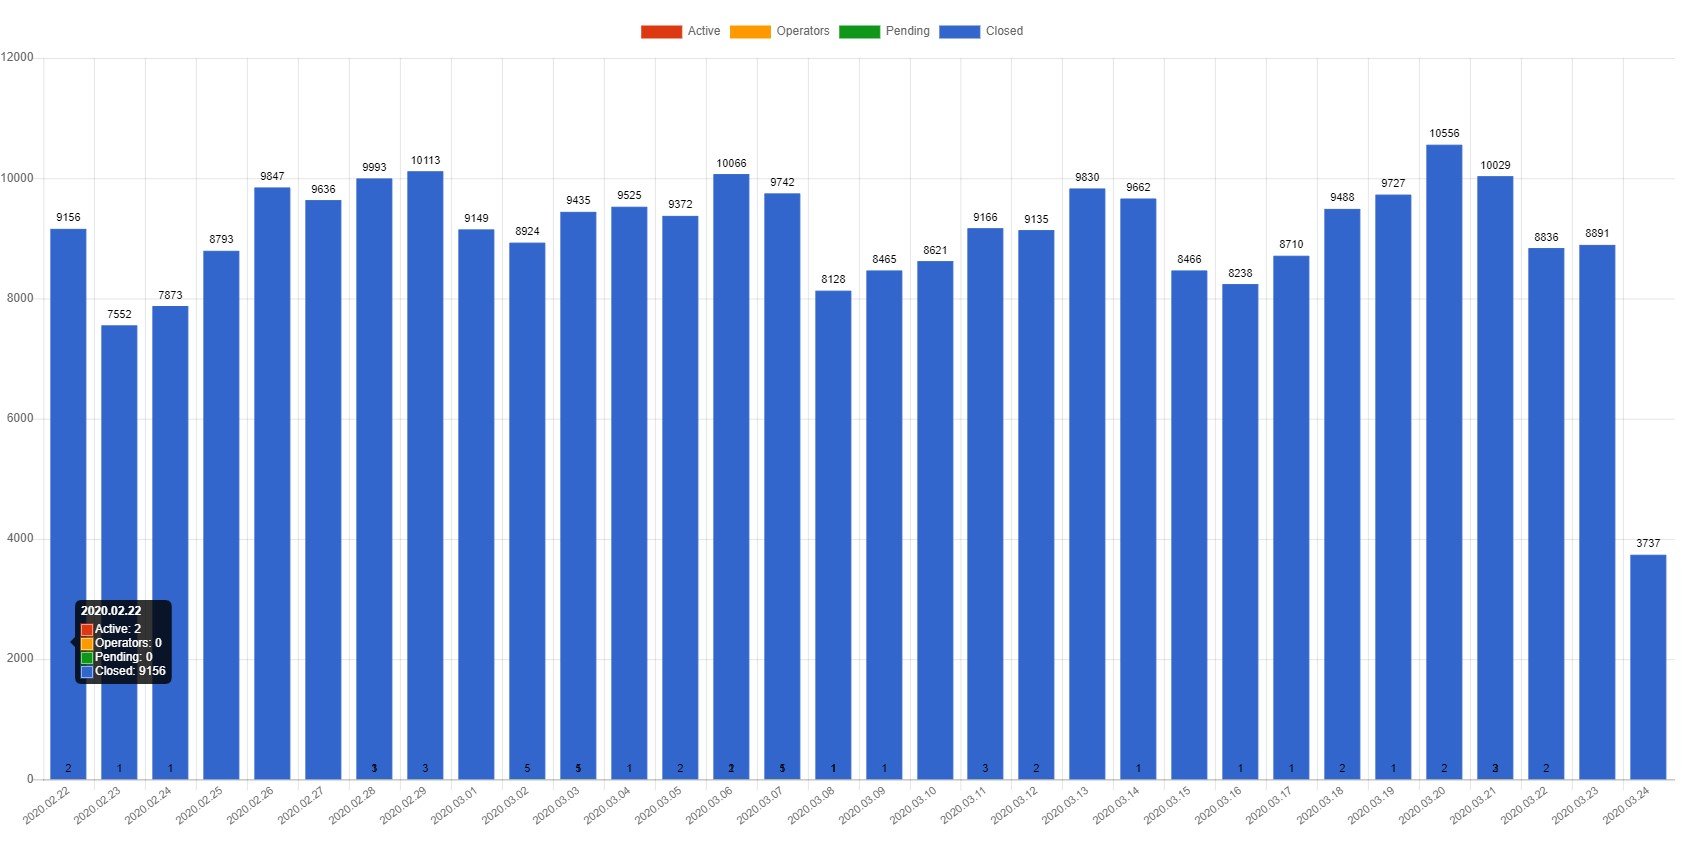
Chats statistic
The main difference between above chats and charts in Chats statistic section charts in this section is can be grouped by day.
Chat numbers by status
Mail statistic
This section allows to generate statistic statistic for mails module
Number of messages per user
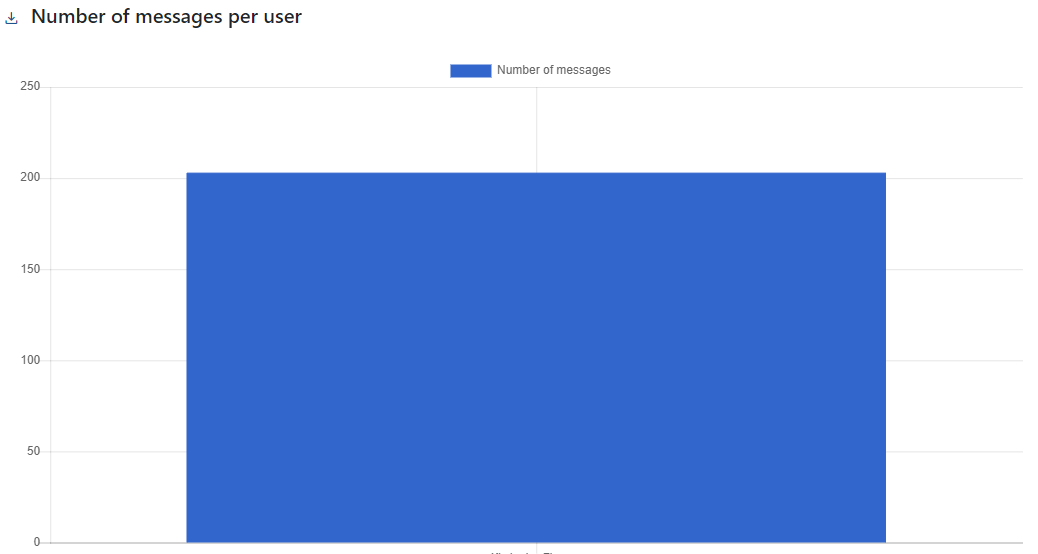
If you see different messages number it's just because statistic is calculated different way.
- Mail list is searching by conversation user id - all messages. ['conv_user_id']
- Statistic is searching exactly by message sender. ['user_id']
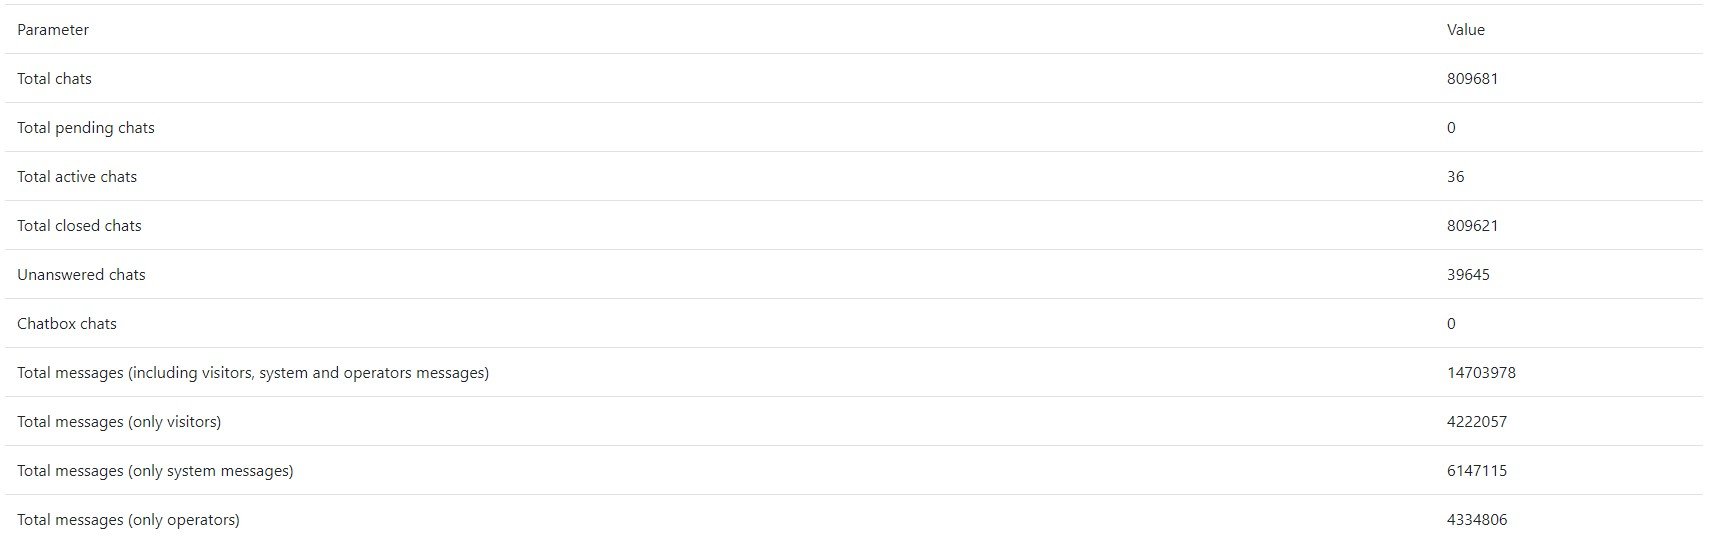
Total statistic
It's lifetime statistic. If you are using archive functionality. This statistic does not include chats from archives.
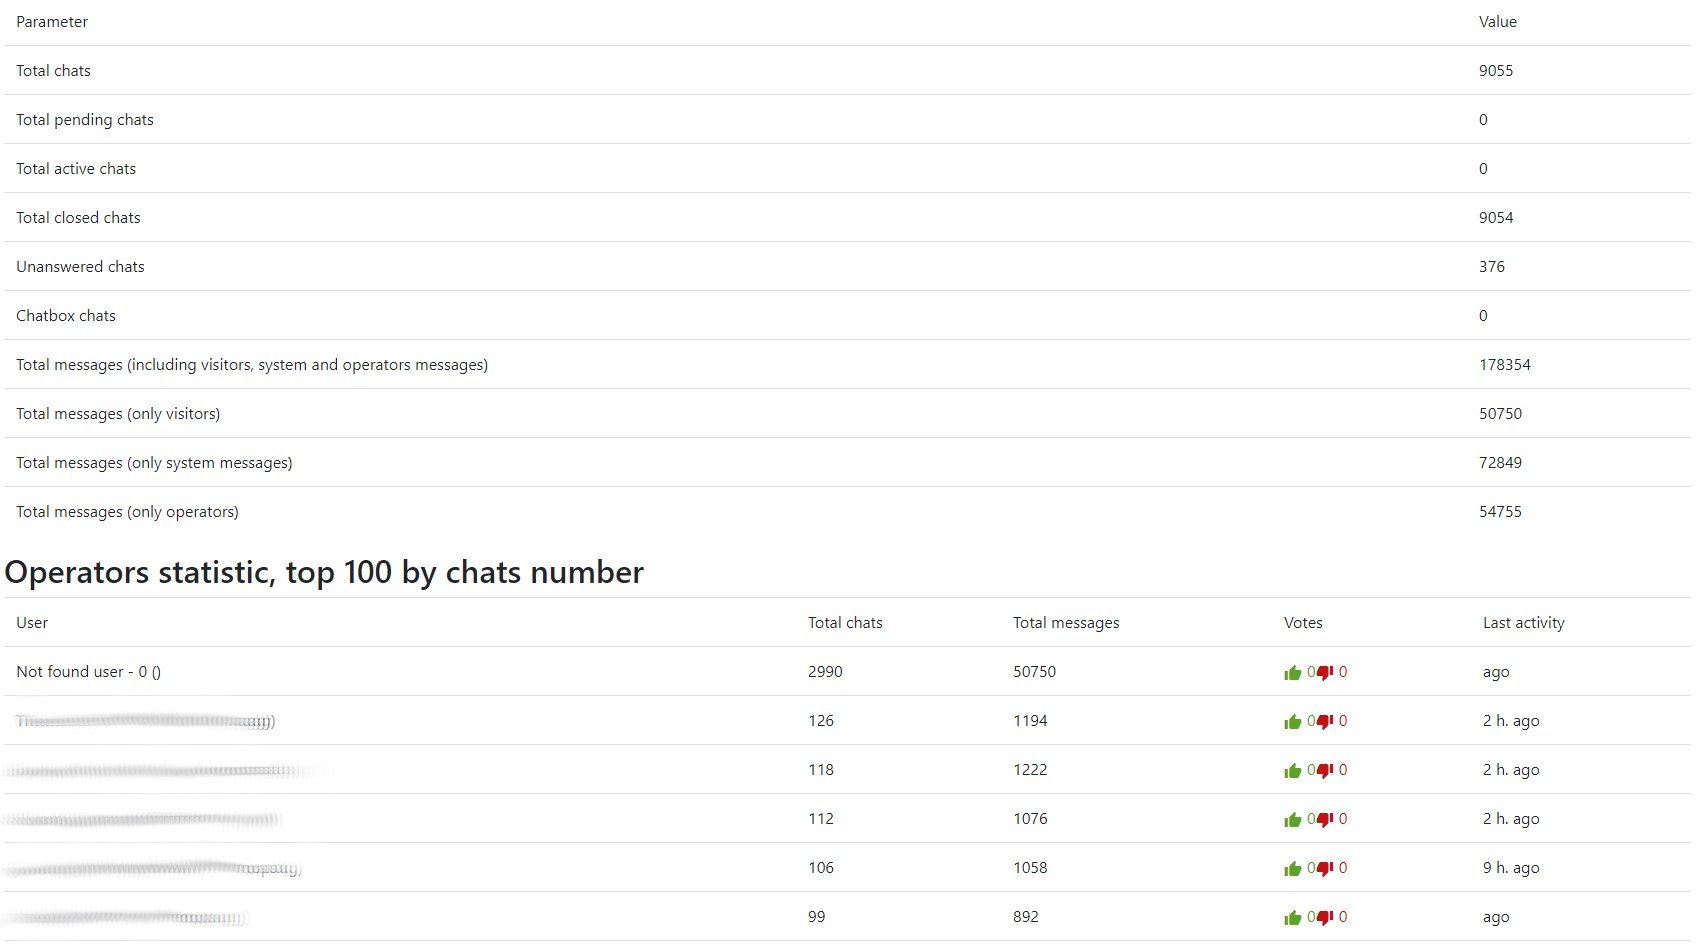
Last 24h statistics
You can get basic last 24 hours statistic in this section.
Agents statistic
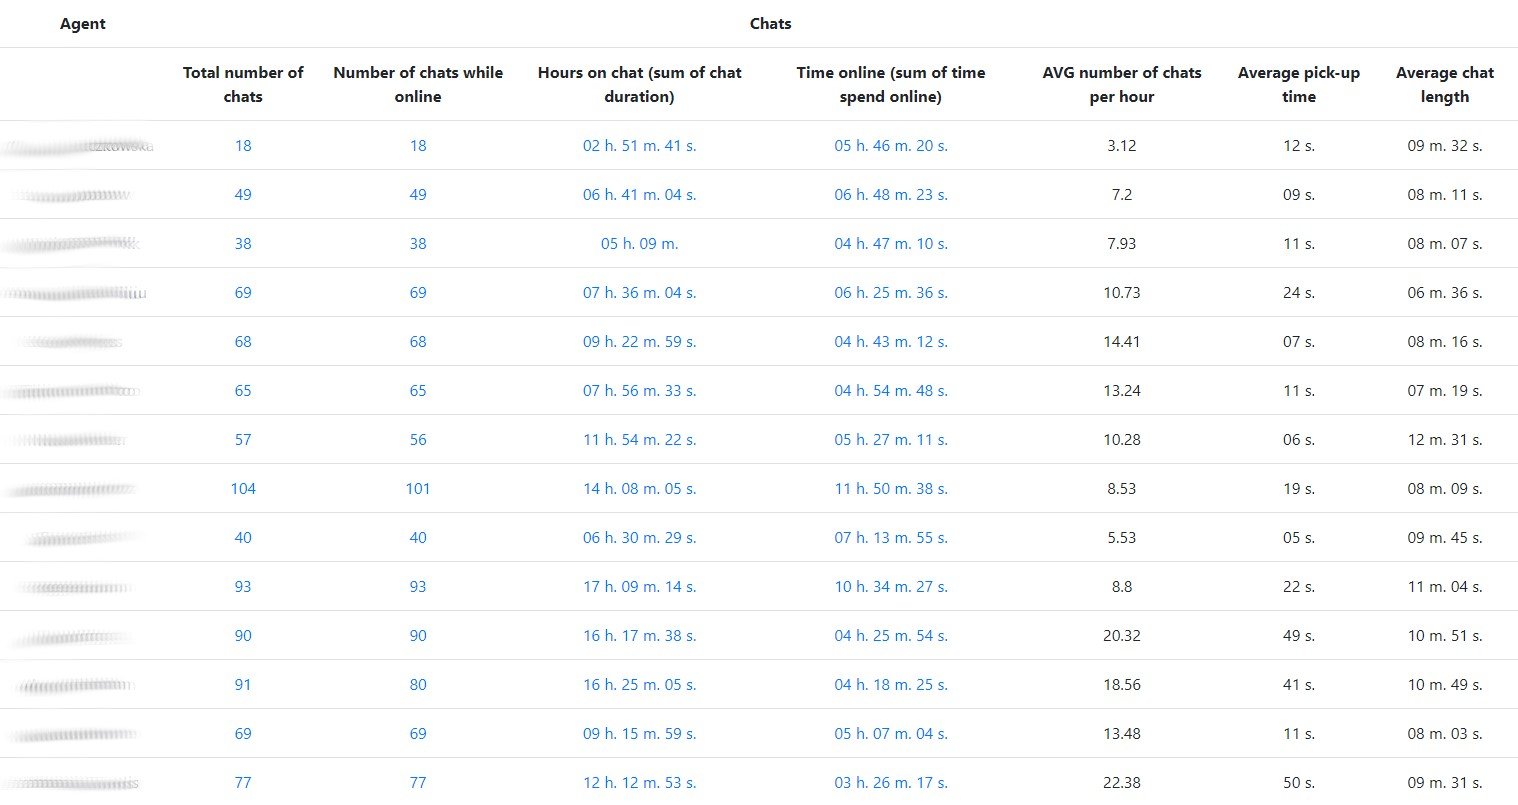
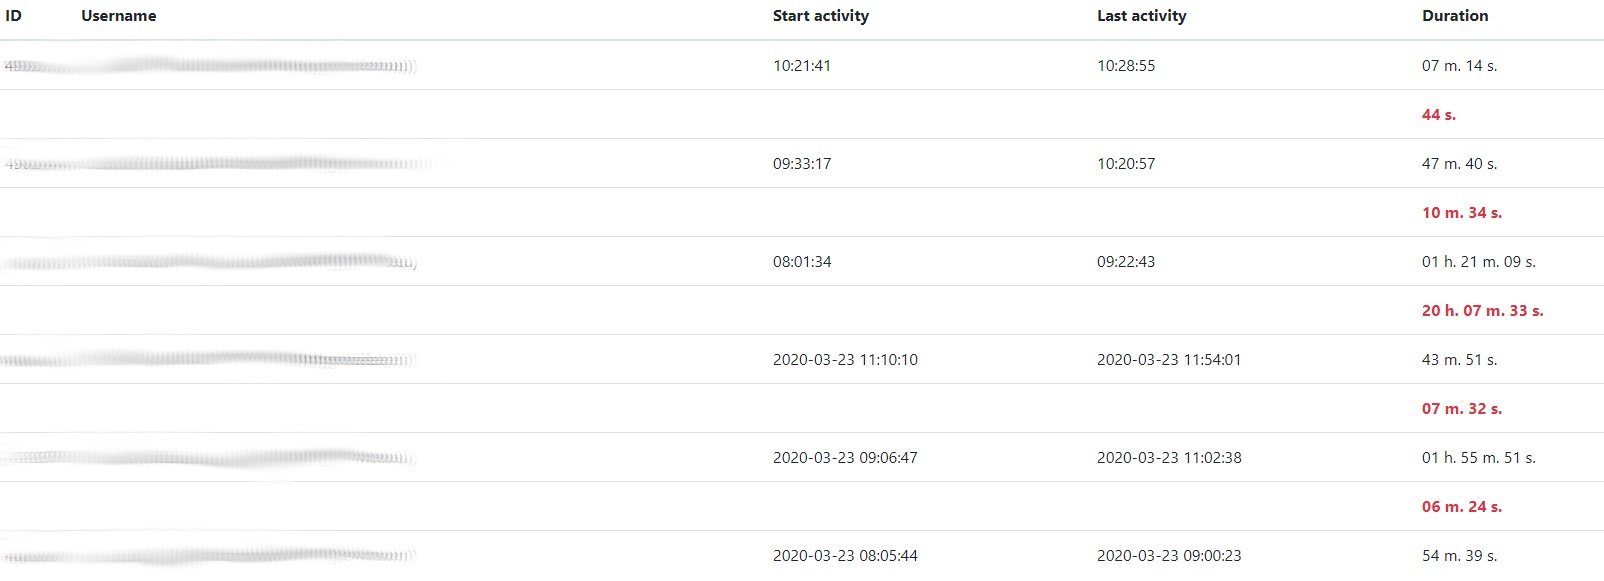
Clicking on Time online (sum of time spend online) will give you log of operator online/offline time.
Performance
This will represent general performance and will let you know how many chats were abandoned before they even got accepted.
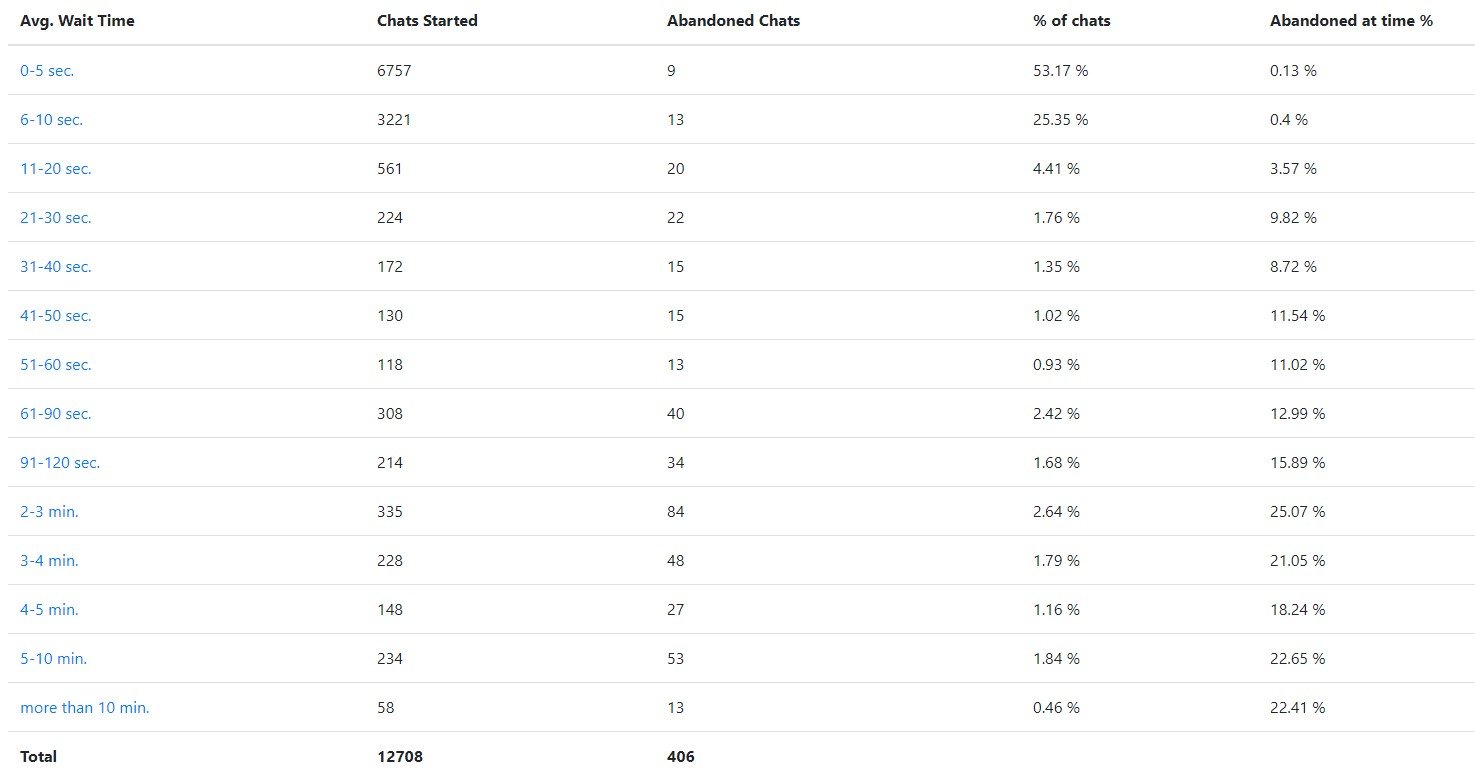
To optimise operators performance and avoid operator accepting abandoned chats it's recommended to setup automatic chat closing for
Automatically close pending chats where visitor has left a chat. Timeout in minutes, last activity by visitor desktop timeout,mobile timeout.
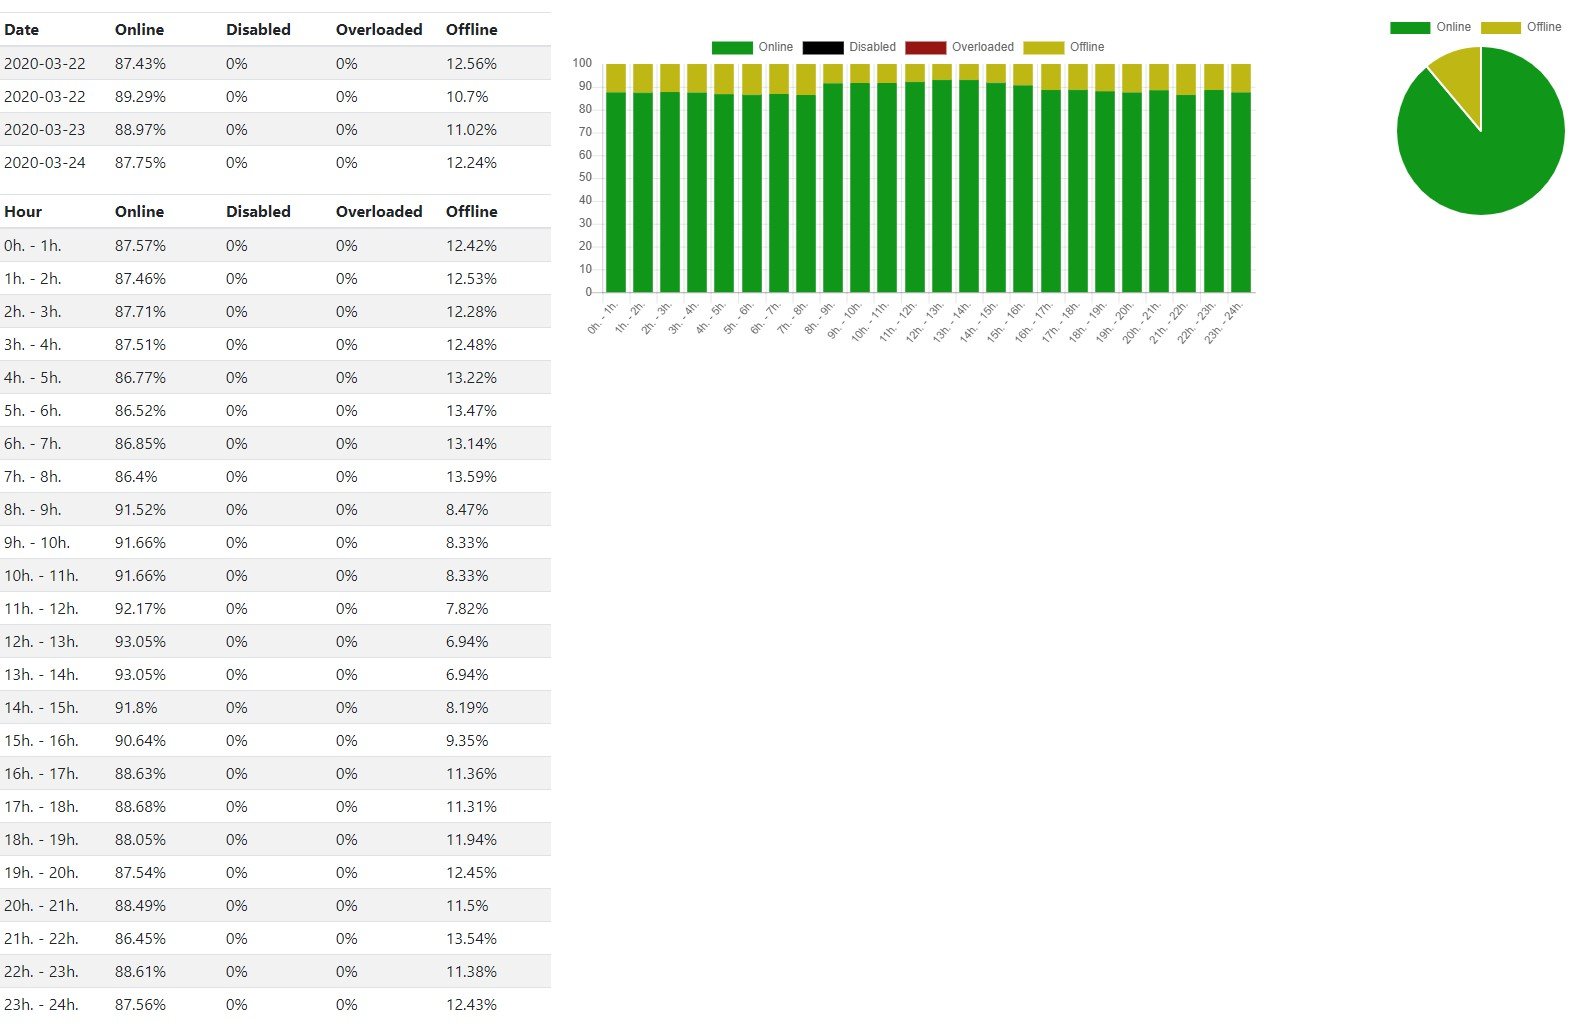
Departments
If you have running department availability cronjob you will be able to generate this chart.
Visitors
These charts can take really long to generate so make sure you choose quite short period of time day/week.
Cities
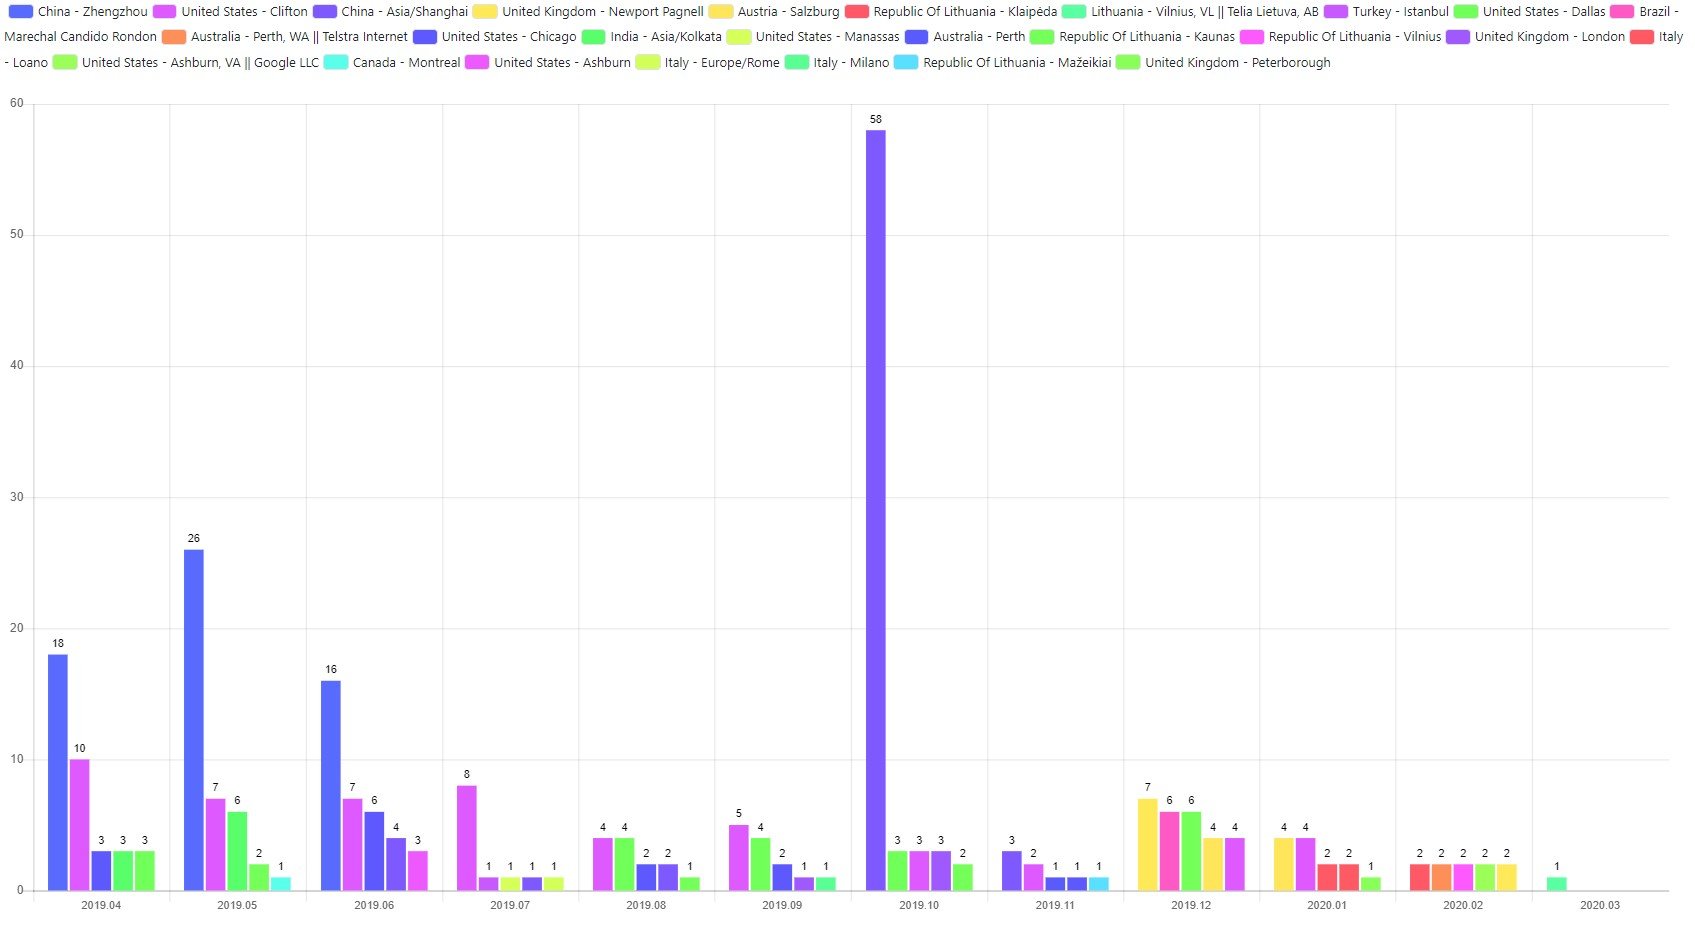
Countries
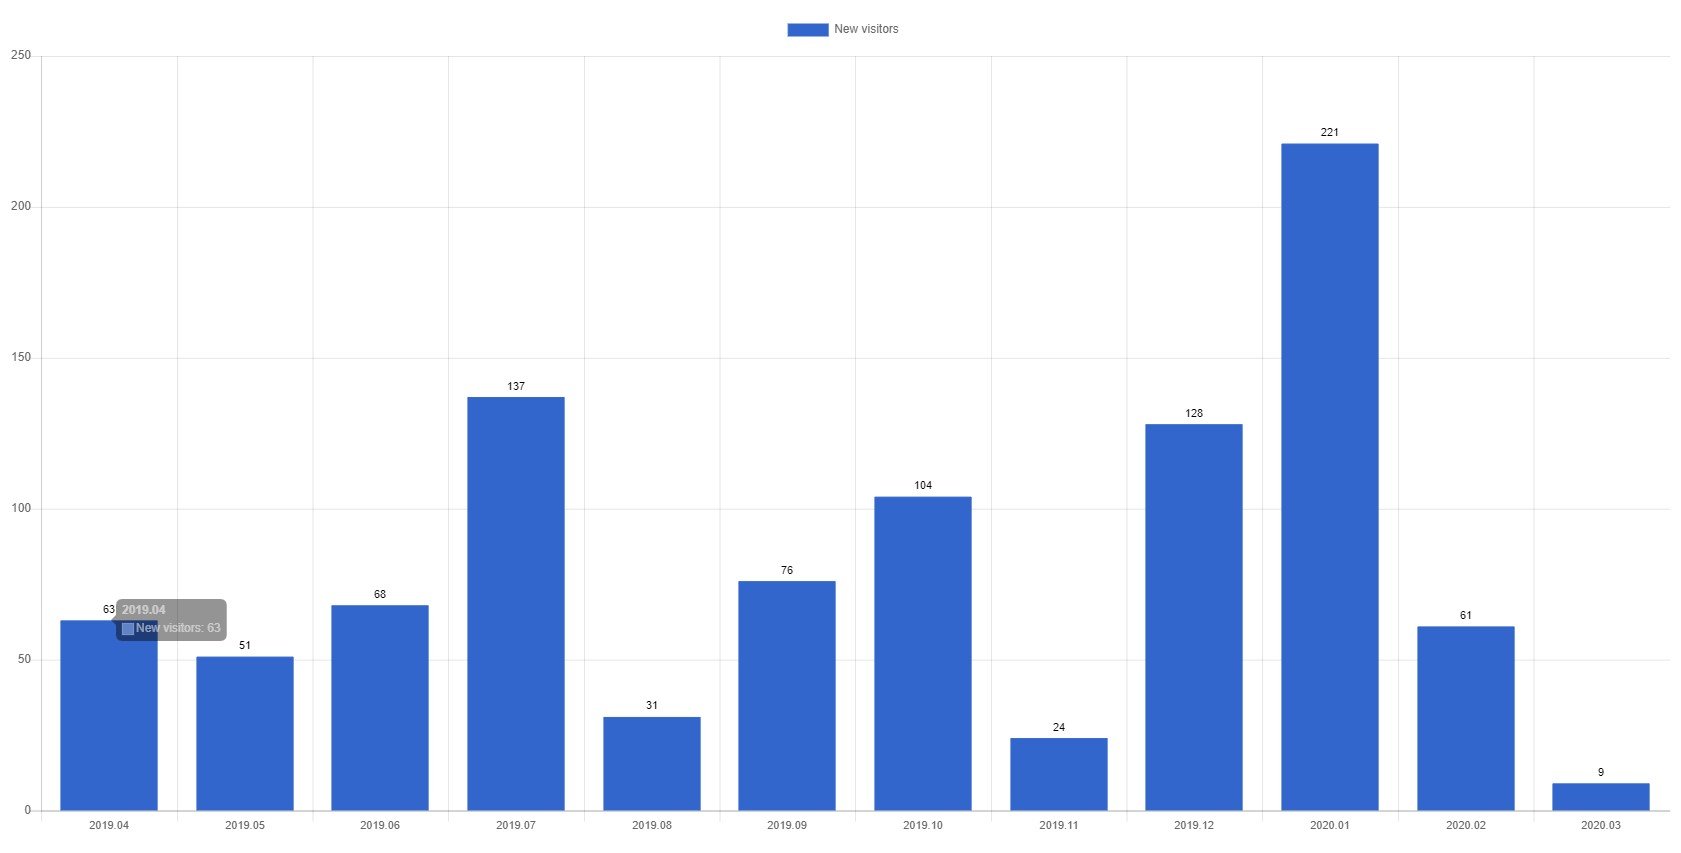
New visitors
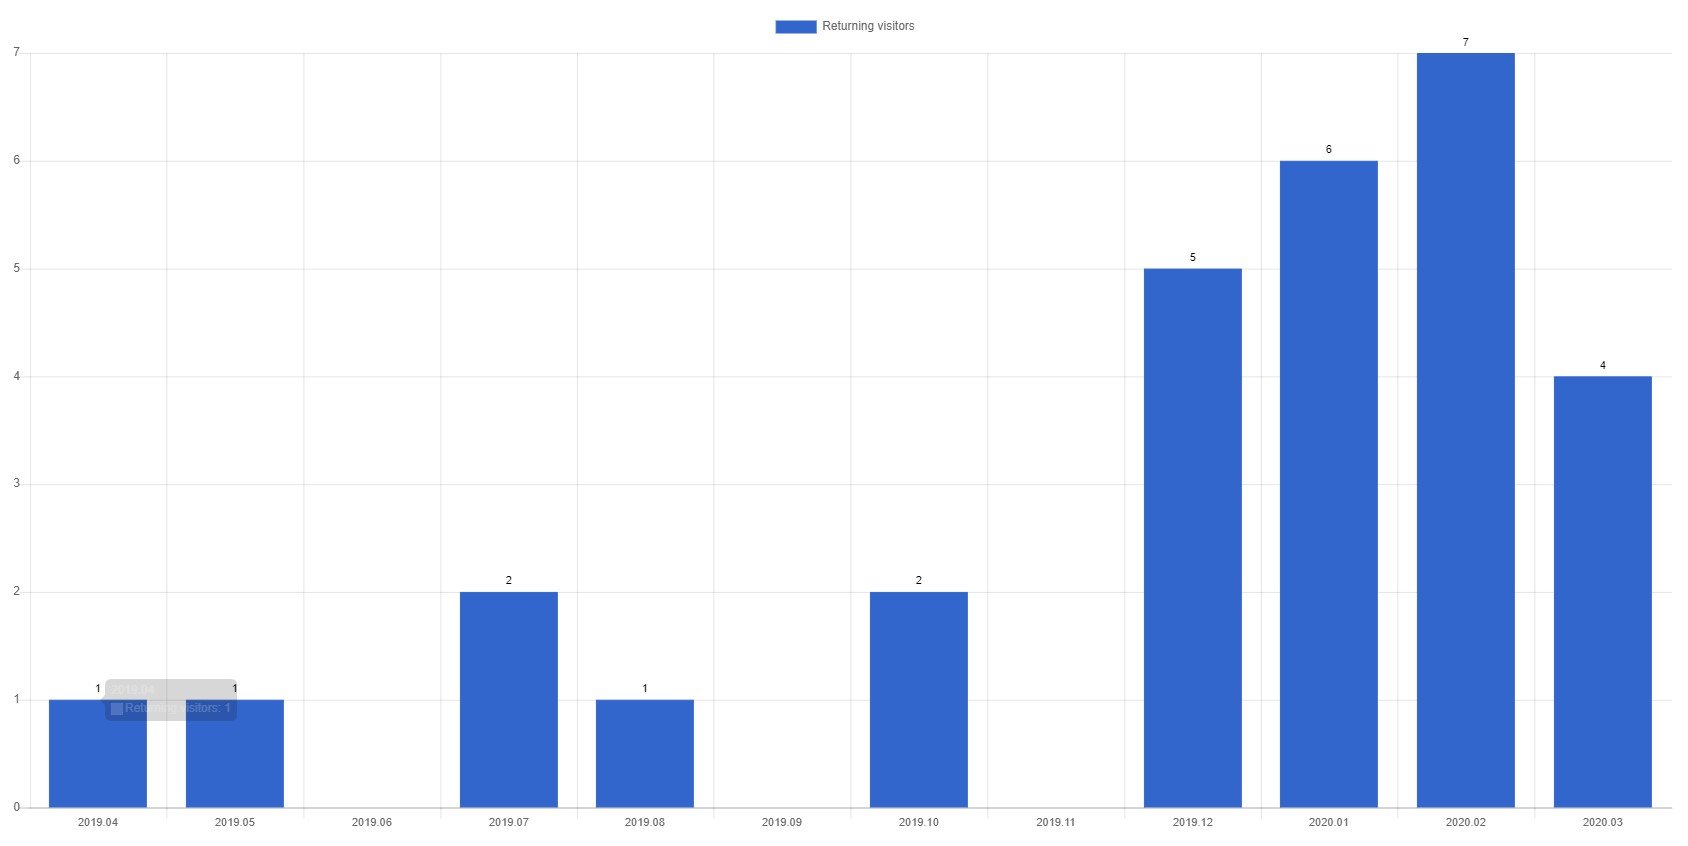
Returning visitors
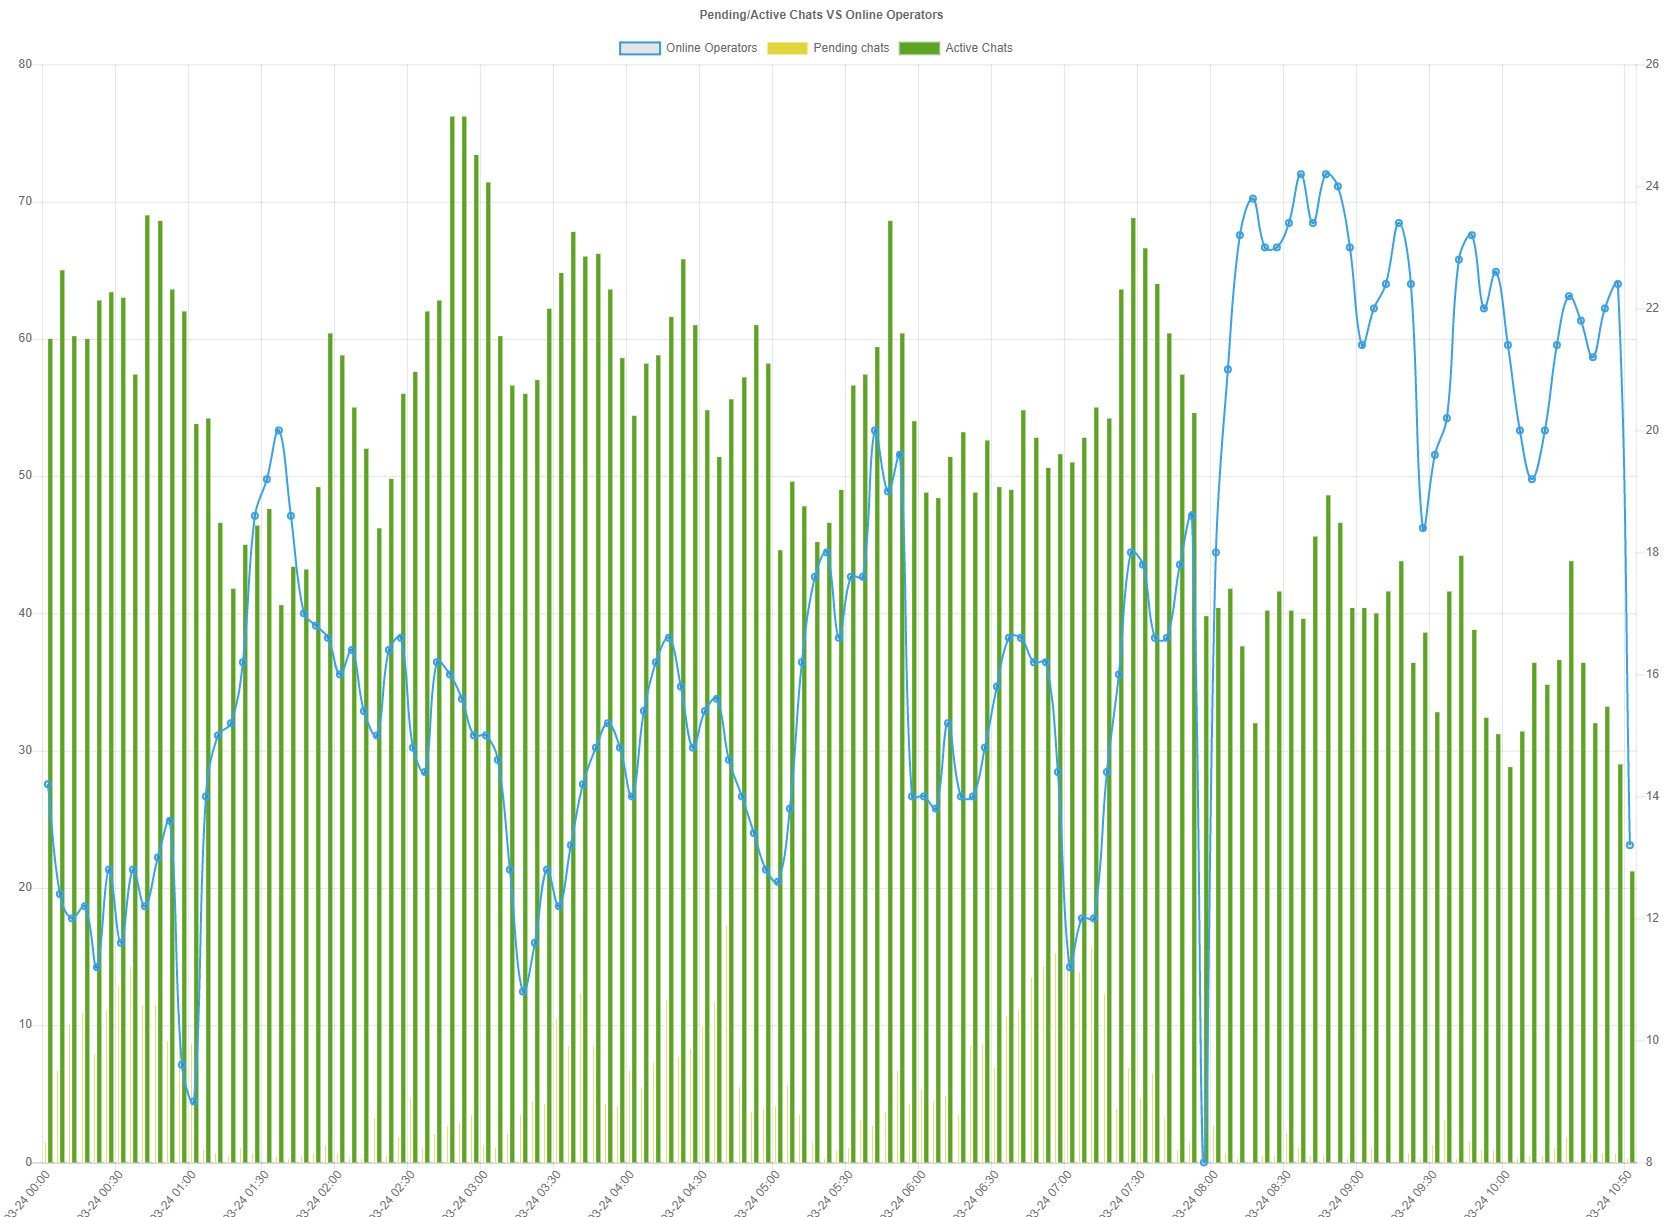
Pending VS Online
This chart is available only if you are using ElasticSearch
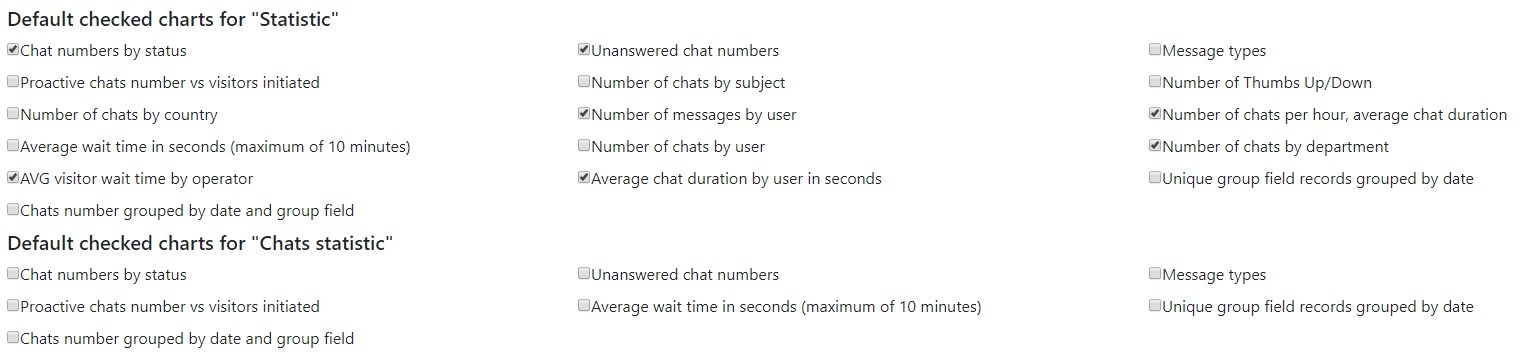
Configuration
In this section you can choose what charts should be checked by default for generation.
In order operator to see all departments statistic even the ones operator do not belong to, he has to have these permissions:
'lhdepartment', 'see_all' and 'lhuser', 'see_all'
Permissions
To view statistic
'lhstatistic','viewstatistic'
To allow operator export statistic in XLS. At the moment only department statistic can be exported in XLS.
'lhstatistic','exportxls'
To allow operator configure statistic default charts
'lhstatistic','configuration'